There are a variety of ways to gain a better understanding of the unique strengths and challenges that exist among Indiana’s 92 counties. One of the best ways to do so is to explore data on the basis of the “geographic classification” of counties. Terms such as metropolitan/nonmetropolitan status or urban/rural designation are two commonly used approaches for distinguishing counties on the basis of their geographic characteristics.
While there are several classifications that have been developed by researchers and federal agencies over the years, three represent important components of the Rural Indiana Stats site. We describe each of these typologies in greater depth below.
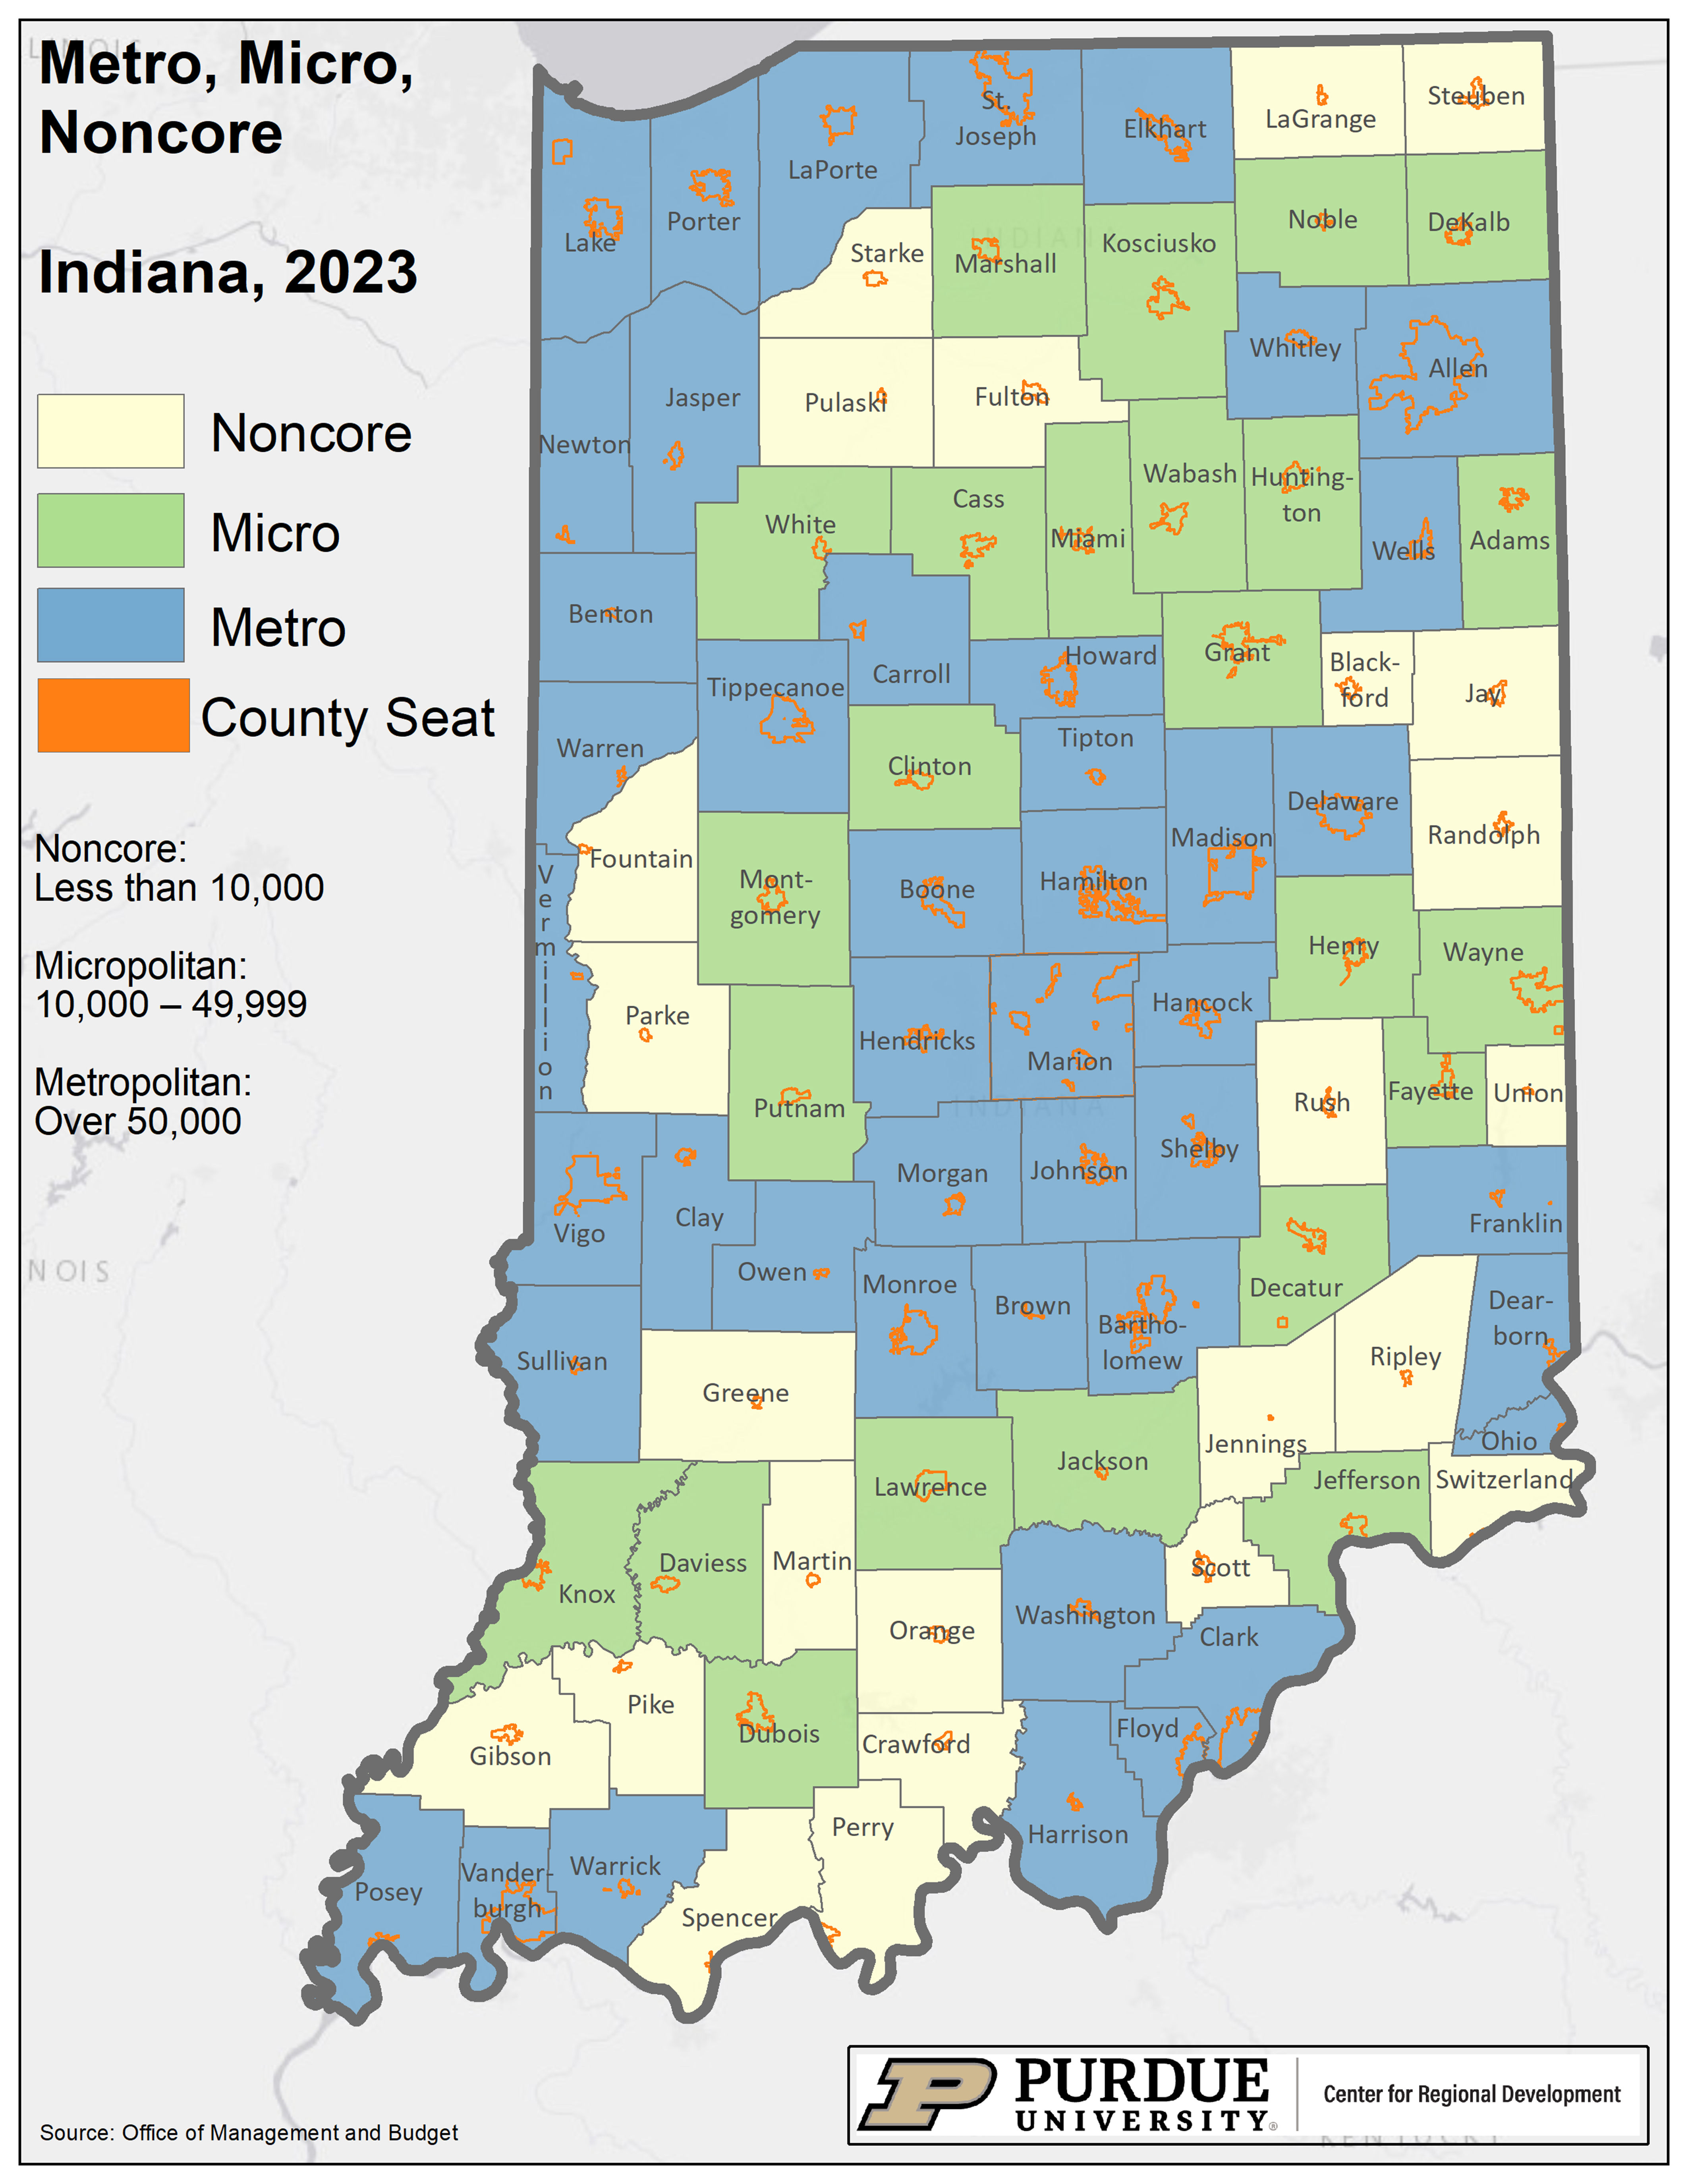
A metropolitan (or metro) area refers to central counties with one or more “urbanized areas” of 50,000 persons or more, as well as outlying counties that have strong economic ties to the central counties. Outlying counties are deemed to be part of a metro area if they have 25 percent or more of their employed workforce commuting to the central county, or if 25 percent or more of the outlying county’s employed labor force is made up of commuters from the central city.
Nonmetropolitan counties can be classified into one of two groups — micropolitan or noncore. Micropolitan counties have one or more urban clusters of 10,000 to 49,999 persons. The Noncore label is assigned to nonmetropolitan counties that fail to meet the micropolitan definition.
Source: Office of Management and Budget (OMB), 2023.
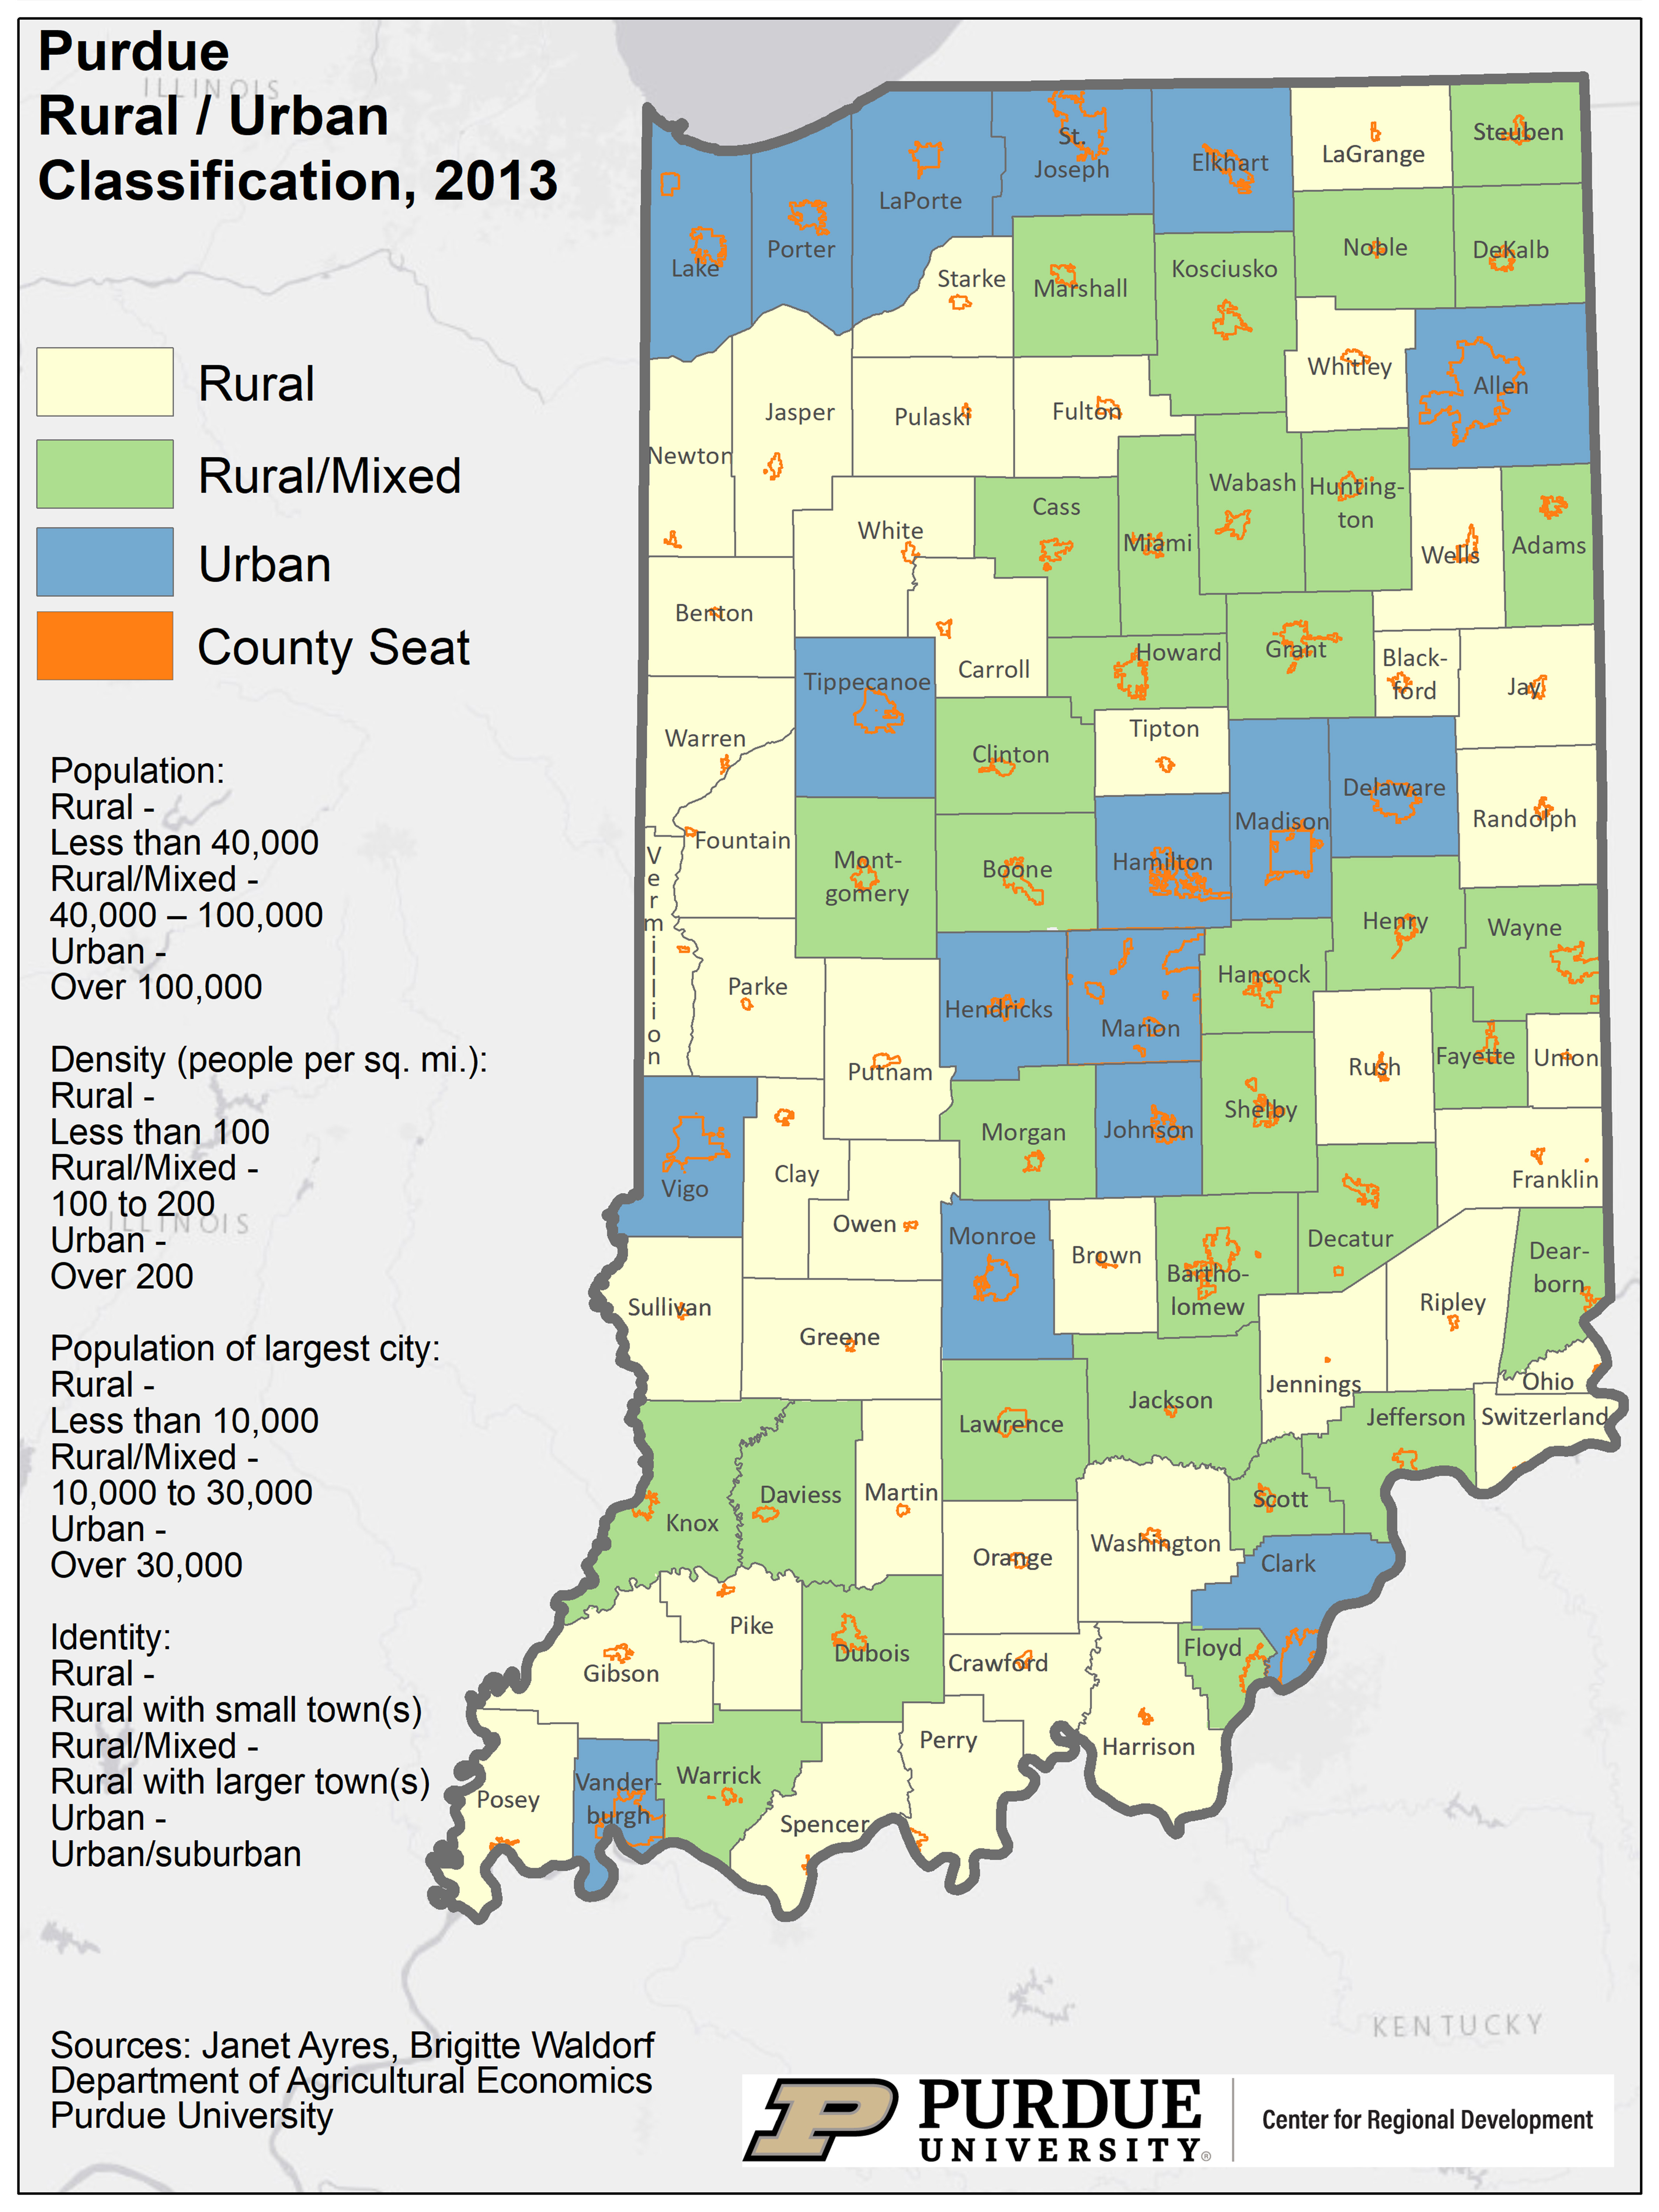
A team of researchers and practitioners from Purdue University developed a new typology in 2013 that was designed to capture the unique features of Indiana’s 92 counties. The classification system began by incorporating three core elements: (1) population size; (2) population density; and (3) the size of the largest city or town in the county. Next, the team added a subjective measure, namely, the “identity” that people had of their county.
Based upon specific thresholds (see Table 1), the state’s 92 counties were assigned into one of three groupings:
To learn more, see the full publication at extension.purdue.edu.
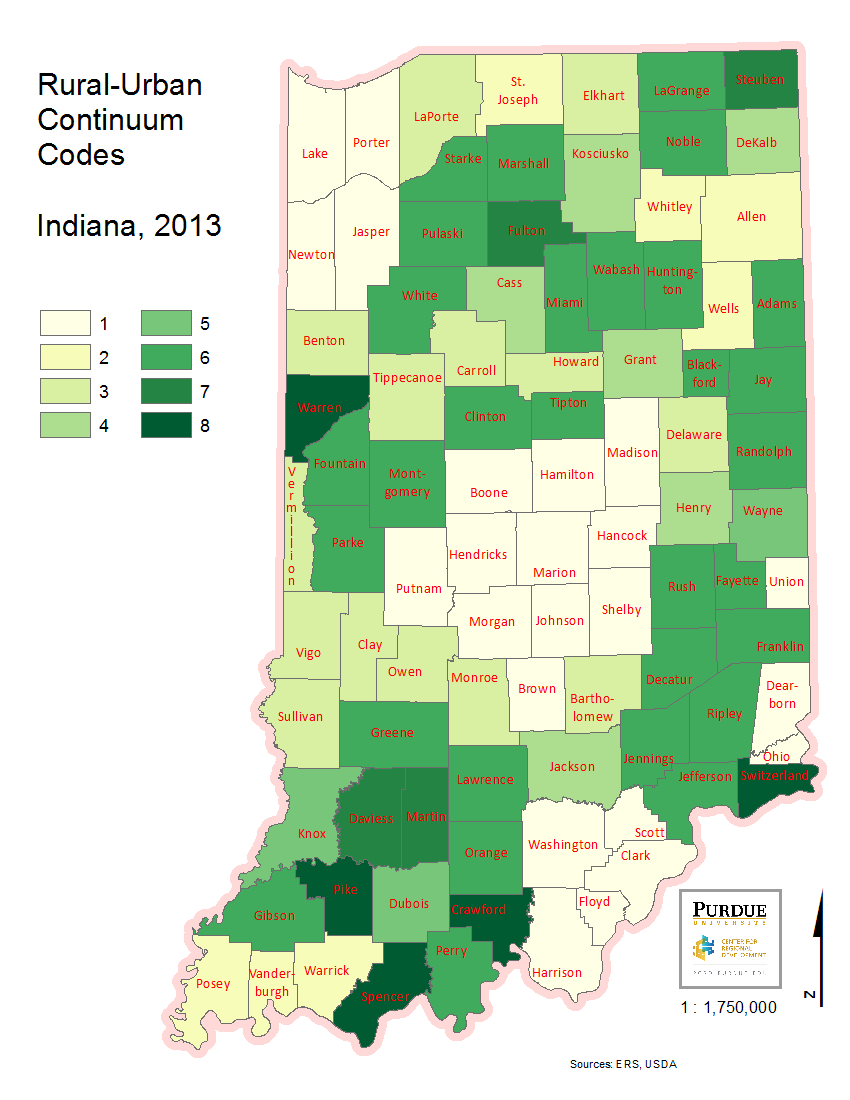
The Rural-Urban Continuum Codes, developed by the Economic Research Service of the USDA, represent one of the most in-depth typologies for differentiating counties. Metropolitan counties are separated into three categories based upon population size. Nonmetropolitan areas are classified into six categories based upon urbanization and adjacency to a metropolitan area (ERS, 2023).
Rural-Urban Designation
For a number of years, the major building block for determining the rural or urban status of areas was linked to size of a place. Specifically, places having a population of 2,500 persons or more were designated “urban.”
In 2002, the U.S. Census Bureau embraced a new way for defining urban and rural areas. Urban refers to all territory, population and housing units located within an Urbanized Area (UA) or Urban Cluster (UC). UAs include areas having a nucleus of 50,000 persons or more, while UCs represent areas having a minimum of 2,500 but less than 50,000 persons. Rural is defined as the territory, population, and housing located outside of a UA and UC.
Urban Influence Codes
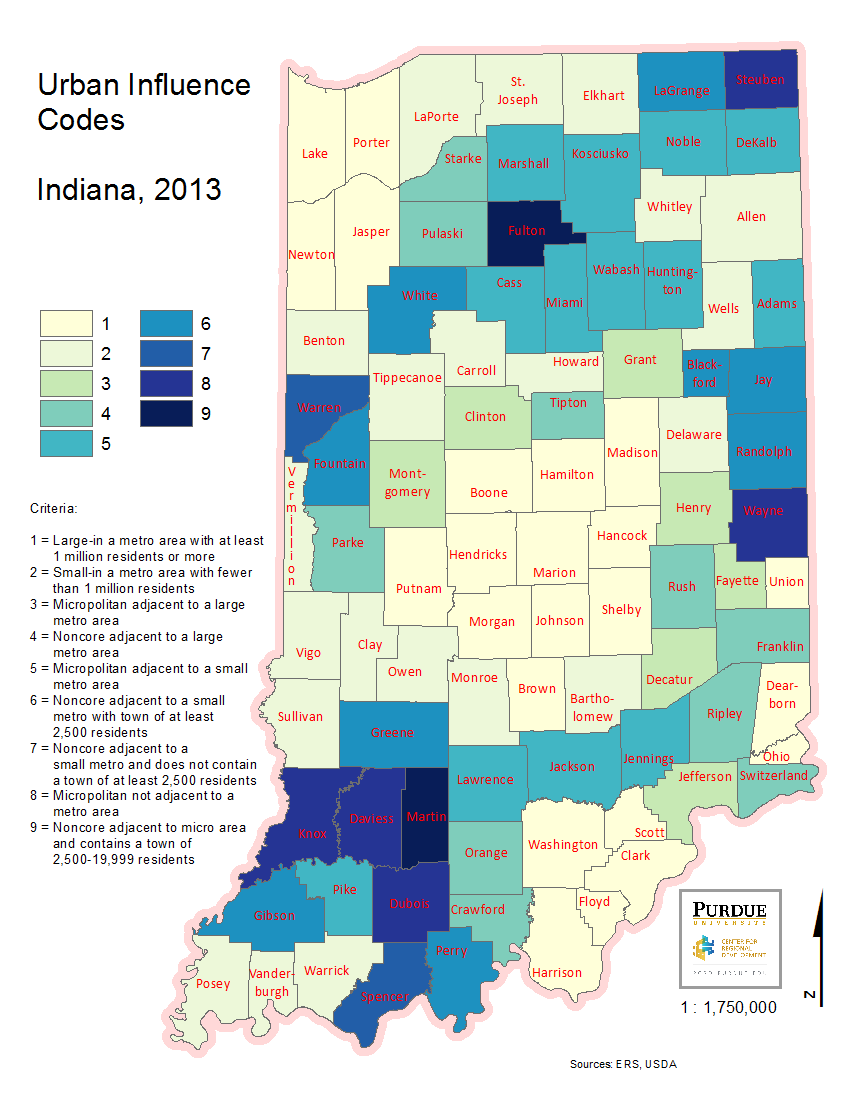
Developed by the Economic Research Service/USDA, this classification captures how population size and access to larger economies affect economic opportunities. The starting point is the metro and nonmetro (micropolitan and noncore) county designations, subdivided into two metro and 10 nonmetro categories, generating a 12-part county classification system.
Learn more at ERS Urban Influence Codes documentation.
Index of Relative Rurality
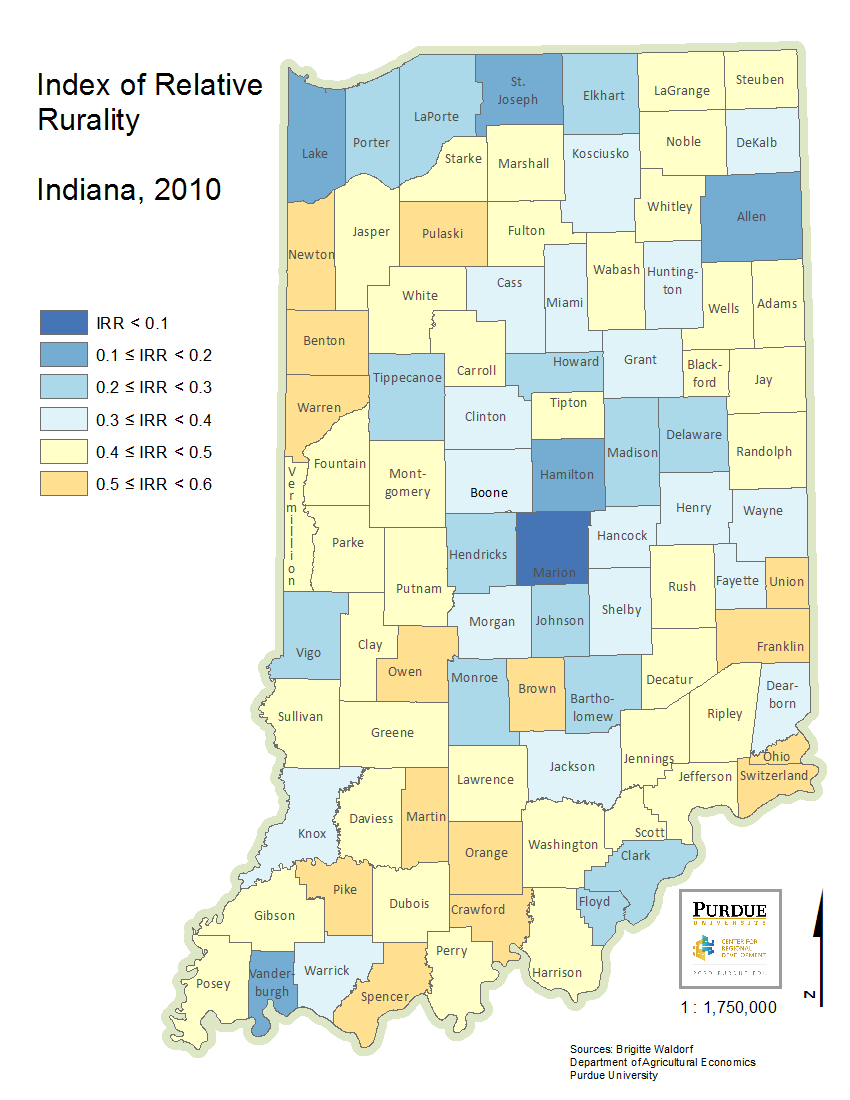
Unlike other geographic classifications, the Index of Relative Rurality represents a continuous measure of rurality ranging from “0” (most urban) to “1” (most rural). Several Indiana counties (54 counties) have moderate levels of rurality (scores 0.4 to 0.6) while 20 tend to be far more urban (scores 0.3 or lower).
See Brigitte Waldorf’s publication for more detail.
| Distribution of Indiana Counties on the IRR | |
|---|---|
| IRR < 0.1 | 1 county |
| 0.1 ≤ IRR < 0.2 | 5 counties |
| 0.2 ≤ IRR < 0.3 | 14 counties |
| 0.3 ≤ IRR < 0.4 | 18 counties |
| 0.4 ≤ IRR < 0.5 | 39 counties |
| 0.5 ≤ IRR < 0.6 | 15 counties |
EDA Distressed Counties
The Economic Development Administration offers a variety of grant opportunities to areas deemed economically distressed. A county qualifies if it meets either of the following criteria:
Unemployment rate
At least 1 percent greater than the national average for the most recent 24-month period.
Per capita income
At or below 80 percent of the national average.
Special need
May apply for major economic events such as sizable job losses, defense cutbacks, or natural disasters.
These thresholds are often used as a starting point for assessing eligibility before applying the EDA’s broader special-needs review.
For more, visit StatsAmerica’s distress tool.
| Metropolitan / Nonmetropolitan Areas | |
|---|---|
| Metropolitan | Central counties with one or more UAs of 50,000+ residents and outlying counties economically tied to central counties (25%+ commuting threshold). |
| Micropolitan | Nonmetro counties with an urban cluster of 10,000–49,999 persons and 25%+ commuting threshold. |
| Noncore | Nonmetro counties not meeting the micropolitan designation. No city/town/UC of at least 10,000. |
| Purdue Rural Indiana Classification System | |
| Urban | Pop. > 100,000 • Density > 200/sq mi • Largest city > 30,000 • Identity: Urban |
| Rural/Mixed | Pop. 40,000–100,000 • Density 100–200/sq mi • Largest city 10,000–30,000 • Identity: Rural with larger town(s) |
| Rural | Pop. < 40,000 • Density < 100/sq mi • Largest city < 10,000 • Identity: Rural |
| Rural-Urban Continuum Codes | |
| Metro 1 | Counties in metro areas of 1 million+ persons |
| Metro 2 | Counties in metro areas of 250,000–1 million |
| Metro 3 | Counties in metro areas of < 250,000 |
| Nonmetro 4 | Urban pop. 20,000+, adjacent to metro |
| Nonmetro 5 | Urban pop. 20,000+, not adjacent to metro |
| Nonmetro 6 | Urban pop. 2,500–19,999, adjacent to metro |
| Nonmetro 7 | Urban pop. 5,000–19,999, not adjacent to metro |
| Nonmetro 8 | Urban pop. < 5,000, adjacent to metro |
| Nonmetro 9 | Urban pop. < 5,000, not adjacent to metro |