Exploring the Map
A step-by-step walkthrough of the ArcGIS-powered cluster maps.
Download PDF VersionThis guide covers all three interactive cluster maps — Skill Clusters, Knowledge Clusters, and Industry Clusters. All three share the same layout and tools; only the underlying data differs. Screenshots reference the Skill Clusters map, but the steps apply to all three.
1. Getting Started

Access the map from the Regional Clusters website. From the top menu, select the dashboard you want to view (for example, Skill Clusters). When the dashboard opens, select the map icon to display the interactive map.
2. Basic Layout
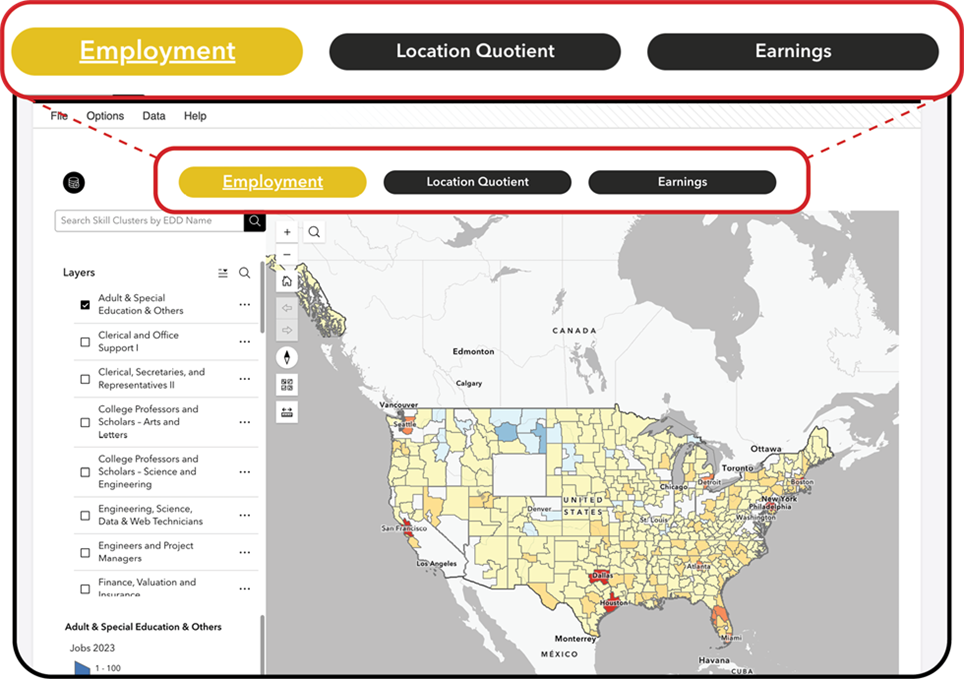
The Skill Cluster map is divided into three main sections: Employment, Location Quotient, and Earnings. The Employment section loads by default. To switch sections, click the name of the section you want to view.
3. Map Structure
The map is fully interactive, allowing users to zoom in and out and explore the geography. The map displays more than 400 Economic Development Districts (EDDs), including regions in Hawaii and Alaska.
Pan the map by clicking and dragging. Zoom using the mouse scroll wheel or the plus and minus buttons. Use the Home button to return to the default map view.
4. Cluster Selection Panel

A panel on the left side lists all available clusters (for example: Adult & Special Education & Others, Planning and Analysis, Statistics and Data Science, Healthcare, Clerical and Office Support, and others).
Select a cluster from the list to update the map. The map will automatically refresh to show the employment levels for the selected cluster. Although multiple layers can be active at once, it is recommended to keep only one active for best clarity.
5. Map Legend & Color Scale

The map uses a color scale to visualize the data. For Skill Clusters – Employment, the colors represent the number of jobs in each EDD. Colors range from light blue (lower job counts) to dark red (higher job counts).
6. Pop-Ups & EDD Information

Click any EDD on the map to open a pop-up window. The pop-up displays the EDD name, the selected cluster name, and the associated data value (for example, number of jobs for that cluster).
7. Navigating Multiple EDDs

If multiple EDDs overlap, use the arrow buttons in the pop-up window to move between them, or click the list icon to see which EDDs have been selected.
8. Searching by EDD Name

You can search for a specific EDD by typing its name into the search bar. The selected EDD will be highlighted, and the map will zoom to its location.
9. Searching by Cluster Name

To search for a specific cluster, open the search option within the Layers window by clicking the magnifying glass icon. Type the name of the cluster you want to locate. For Skill Clusters, there are 38 unique clusters available.
10. Adding Your Own Data

You may upload your own data to display on the map. In the top left corner, select the Add Data button. Supported formats include:
- Shapefile
- CSV
- KML
- GeoJSON
- GPX
- FGDB
11. Navigating Using the Map Tools

The map includes several tools to assist users:
- Search by address — locate a specific place on the map
- Basemap switcher — change the underlying map style
- Measure tool — measure distances and areas
- Print map tool — export the current map view
12. Troubleshooting
01
Map does not load
Refresh the browser or check your internet connection.
02
Colors do not appear
Ensure the selected cluster has data for that region.
03
Pop-ups do not appear
Make sure you are clicking directly on an EDD geography.
13. For More Mapping Help
For map-related assistance, email regionalclusters@purdue.edu or fill out the form on our Contact Page.