Loading Visualzation
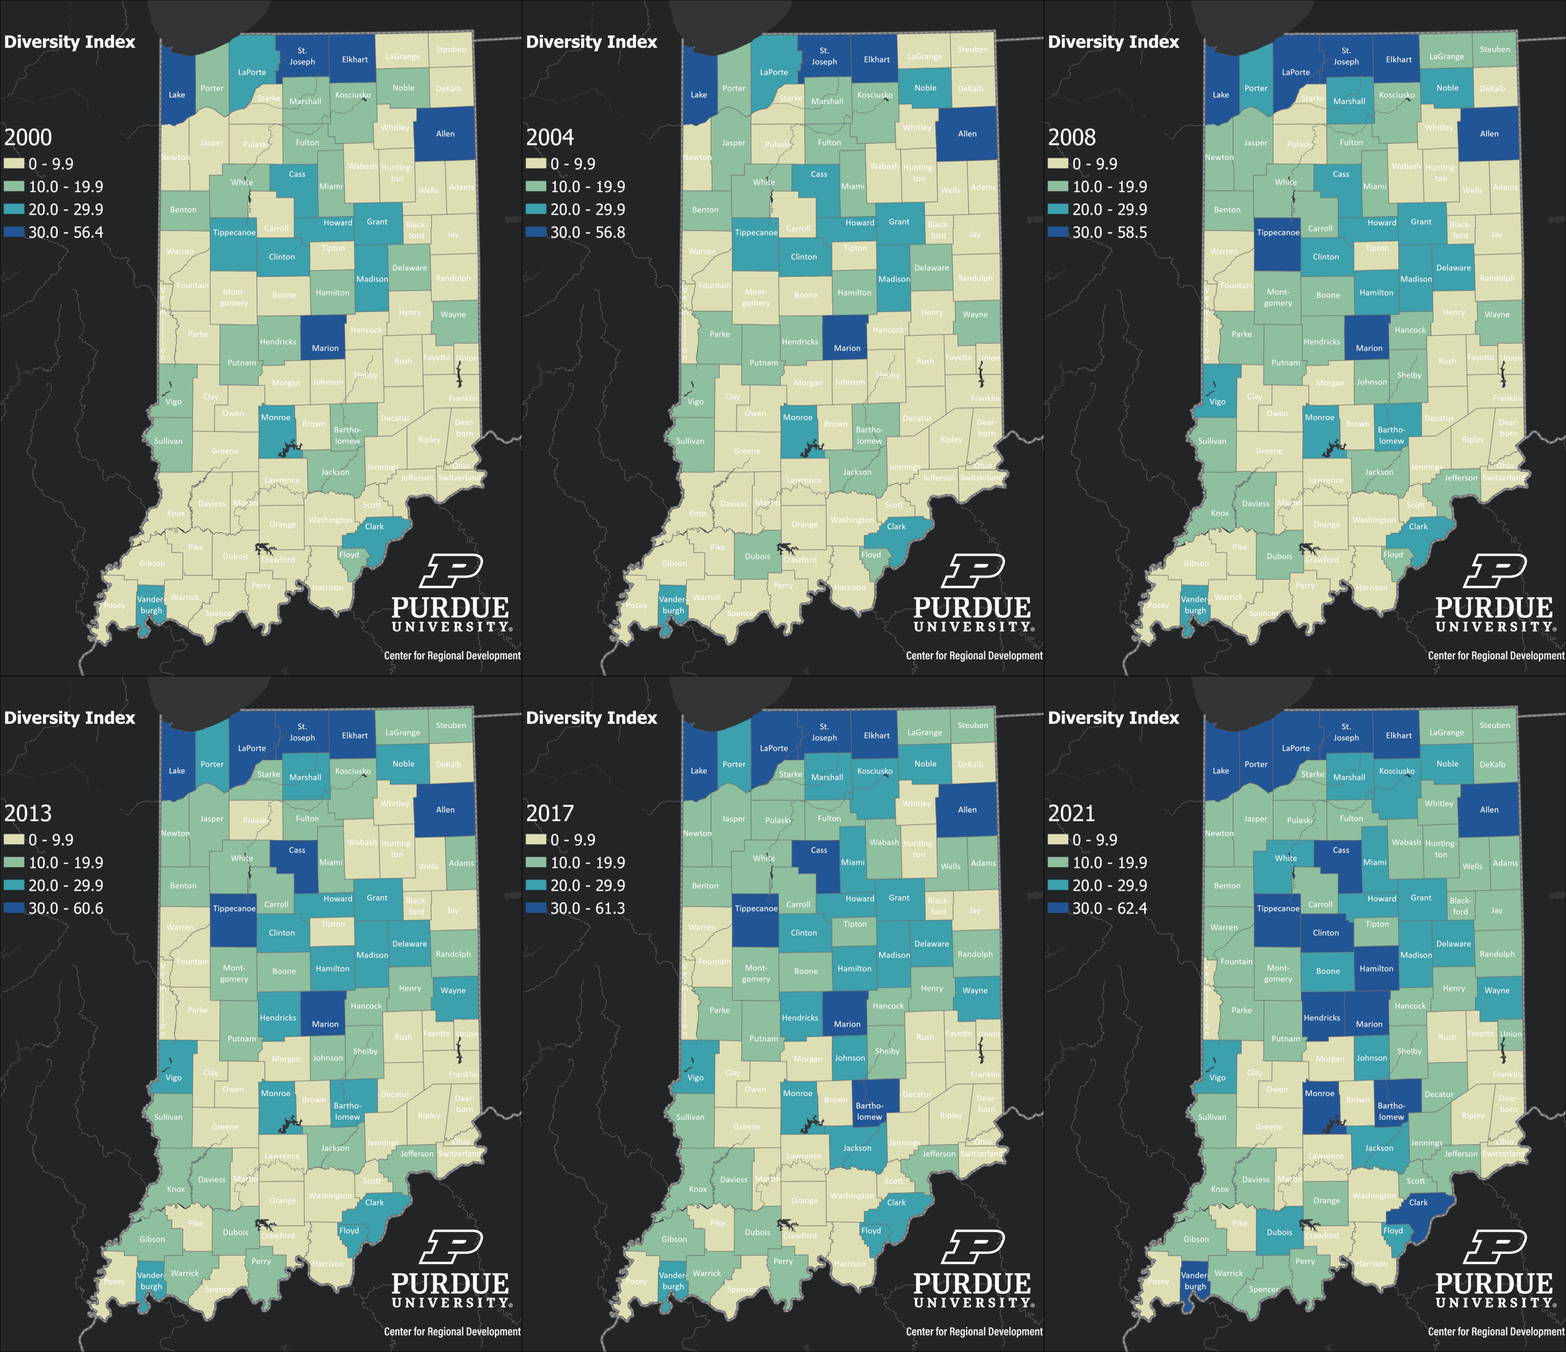
- DescriptonThis animated GIF shows what is called a diversity index or ethnic fractionalization index developed by Alesina et. al. (1999) (https://academic.oup.com/qje/article-abstract/114/4/1243/1934019). This score ranges from 0 to 100 where 0 is no diversity while 100 is complete diversity. A total of 7 mutually exclusive Census Bureau racial and ethnic categories were utilized and obtained from the U.S. Census Population Estimates. As shown, between 2000 and 2021, Indiana counties have become more diverse over time. However, the state is less diverse compared to the country. As of 2021, the diversity index score for the country was 59.2 compared to Indiana’s 38.2.
- CategoryDemographic
- Data dateAugust 5, 2022
- Share
Have Data Needs?
Contact us to see how we can generate useful, beautiful, unique data tools just for you.
Contact Us