Loading Visualzation
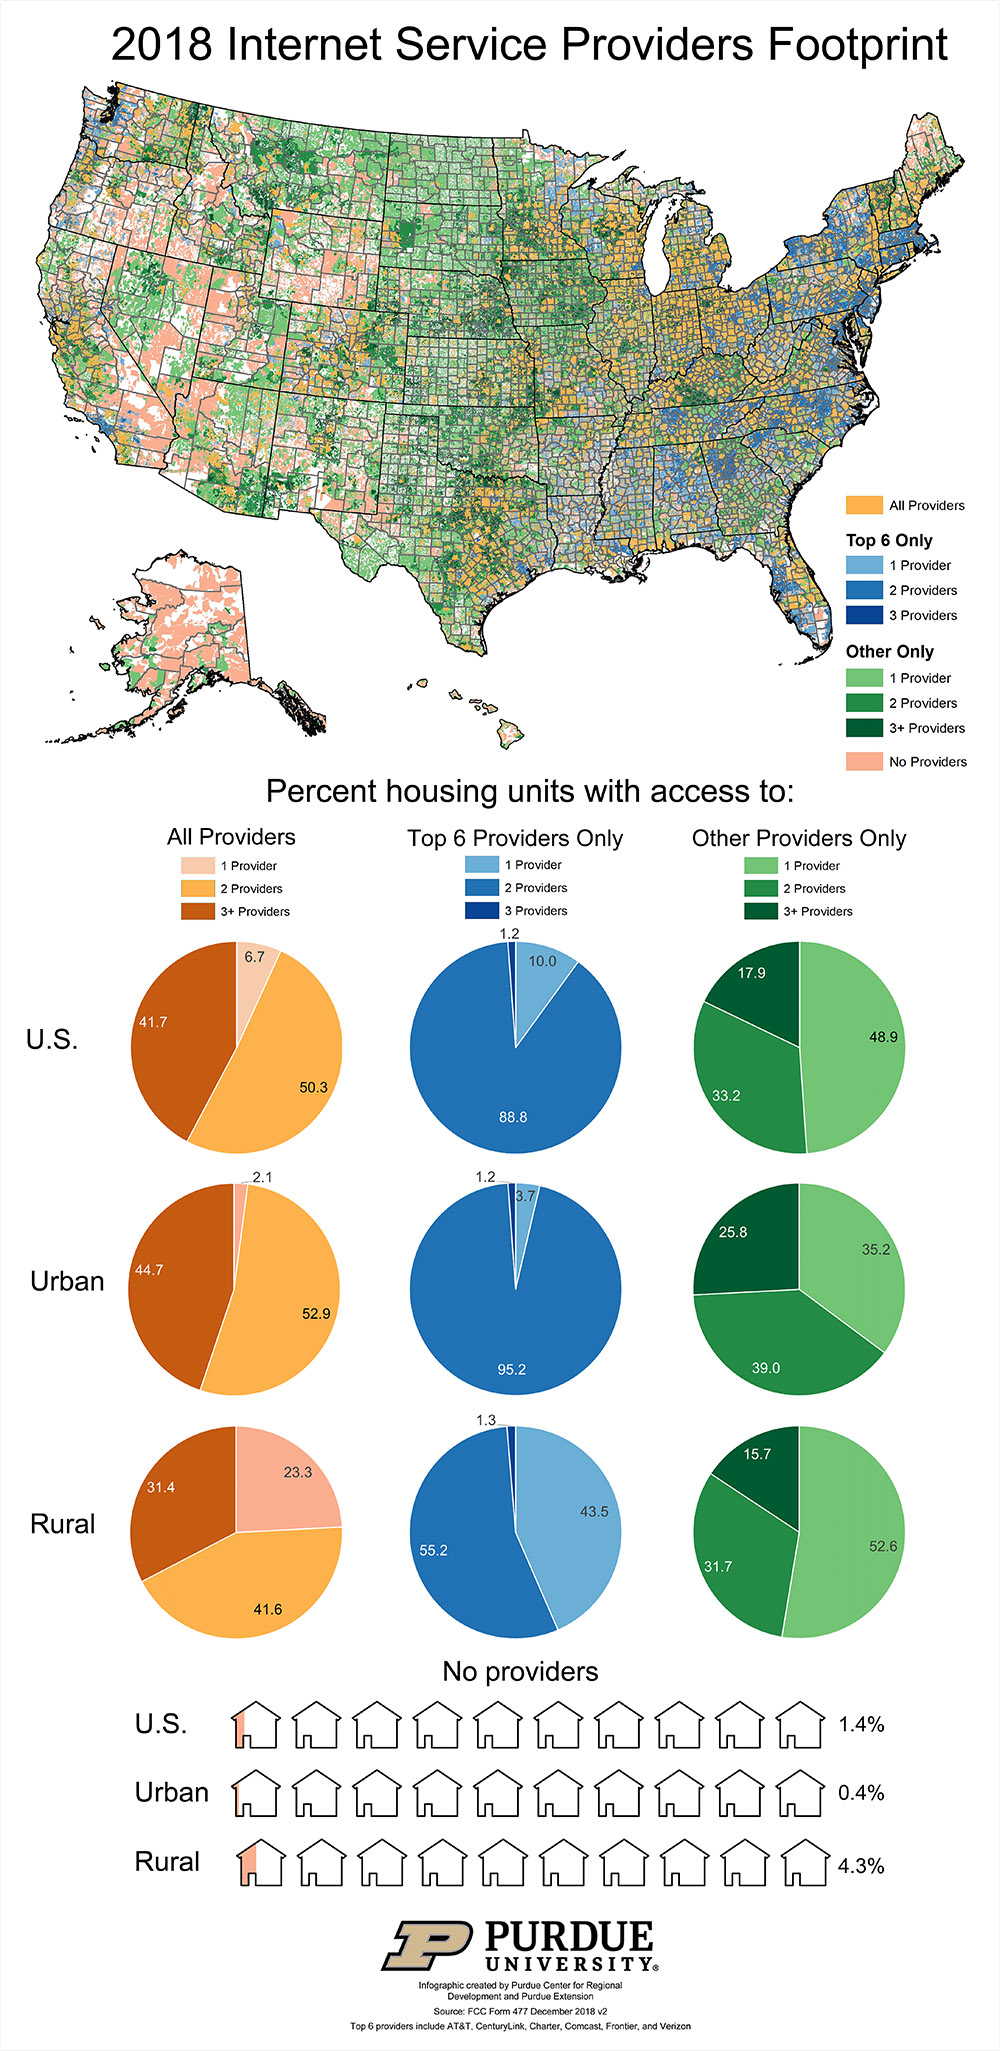
- DescriptonThis infographic shows the 2018 internet service providers footprint in the nation. The breakdown of percent of housing units with access to provider type and number of providers is shown. Note how there are less providers in rural areas of the county, regardless if they are all providers, top 6 or other.
- CategoryDigital Opportunities
- Data dateAugust 1, 2020
Have Data Needs?
Contact us to see how we can generate useful, beautiful, unique data tools just for you.
Contact Us