2018 Digital Divide Index (DDI) Now Available

The DDI is a score that ranges from zero to 100, where a higher score indicates a higher divide. The DDI is calculated considering two main factors: the infrastructure/adoption score (INFA) and the socioeconomic score (SE). INFA looks at access and adoption levels (including median advertised speeds), while SE looks at socioeconomic characteristics that affect technology adoption. The DDI is available for Census tracts and counties in the United States.
For more information on the DDI or to request the data, please visit here.
If the SE score or is higher than the INFA score, then efforts need to be made to focus on digital literacy and/or relevance. On the other hand, if the INFA score is higher than the SE score, efforts need to be made to improve the infrastructure and making it more affordable. This is useful information considering communities have scarce resources and need to identify priorities.
The top ten counties with the lowest score are listed in Table 1. Notice that although the DDI is low, the majority of these counties had adequate infrastructure and adoption levels (INFA). However, since SE scores were much higher, efforts need to be made to improve literacy and relevance.
Table 1. Top Ten Counties with Lowest Digital Divide Index Score
| Name | State | Type | DDI | INFA | SE |
|---|---|---|---|---|---|
| Sully | South Dakota | Small City | 0.00 | 0.40 | 20.48 |
| Morton | North Dakota | Metropolitan | 0.76 | 2.46 | 18.68 |
| Mercer | North Dakota | Rural | 1.16 | 1.37 | 21.27 |
| Edmunds | South Dakota | Small City | 1.78 | 0.37 | 24.13 |
| Mountrail | North Dakota | Rural | 1.84 | 4.66 | 17.29 |
| Renville | North Dakota | Small City | 2.28 | 1.40 | 23.47 |
| Richland | North Dakota | Small City | 3.10 | 1.85 | 24.42 |
| Foster | North Dakota | Rural | 3.48 | 0.56 | 27.27 |
| Red Lake | Minnesota | Rural | 3.75 | 0.30 | 28.25 |
On the other hand, the top ten counties with the highest divide or score are listed in Table 2. Again, to prioritize efforts, look at which of the DDI main component scores was higher and plan on addressing those first.
Table 2. Top Ten Counties with Highest Digital Divide Index Score
| Name | State | Type | DDI | INFA | SE |
|---|---|---|---|---|---|
| East Carroll | Louisiana | Rural | 100.00 | 88.18 | 80.83 |
| Kenedy | Texas | Small City | 98.33 | 76.24 | 96.82 |
| Wheeler | Georgia | Rural | 95.25 | 100.00 | 52.04 |
| Telfair | Georgia | Rural | 93.58 | 92.81 | 60.31 |
| Greene | Alabama | Rural | 91.45 | 74.36 | 85.91 |
| Perry | Alabama | Rural | 88.72 | 71.79 | 84.57 |
| Tensas | Louisiana | Rural | 87.07 | 78.68 | 70.04 |
| Apache | Arizona | Rural | 83.93 | 81.42 | 59.21 |
| Issaquena | Mississippi | Rural | 83.90 | 64.88 | 85.99 |
But, who is on the wrong side of the divide as measured by the DDI?
To answer this, counties were divided into four equal groups or quartiles based on their DDI. We then looked at multiple indicators to see who is being affected the most by the digital divide. About 192 million or close to 60% of the population lived in counties with a low digital divide compared to 13.5 million or 4% living in counties with the highest divide (not shown).
First, let’s take a look at connectivity and digital distress indicators.
According to the 2018 (December) Federal Communications Commission dataset, about 3.2% of housing units in the country did not have access to any providers compared to 2% in counties with the lowest digital divide versus 14.4%—a sevenfold increase—in those areas where the divide was the highest.
The same pattern is seen regarding percent housing units with access to 25/3 and 100/20: a significantly higher share of housing units had access to both speed thresholds in counties with the lowest divide compared to the percentage of housing units in areas with the highest divide. Lack of access to adequate connectivity makes the divide wider.
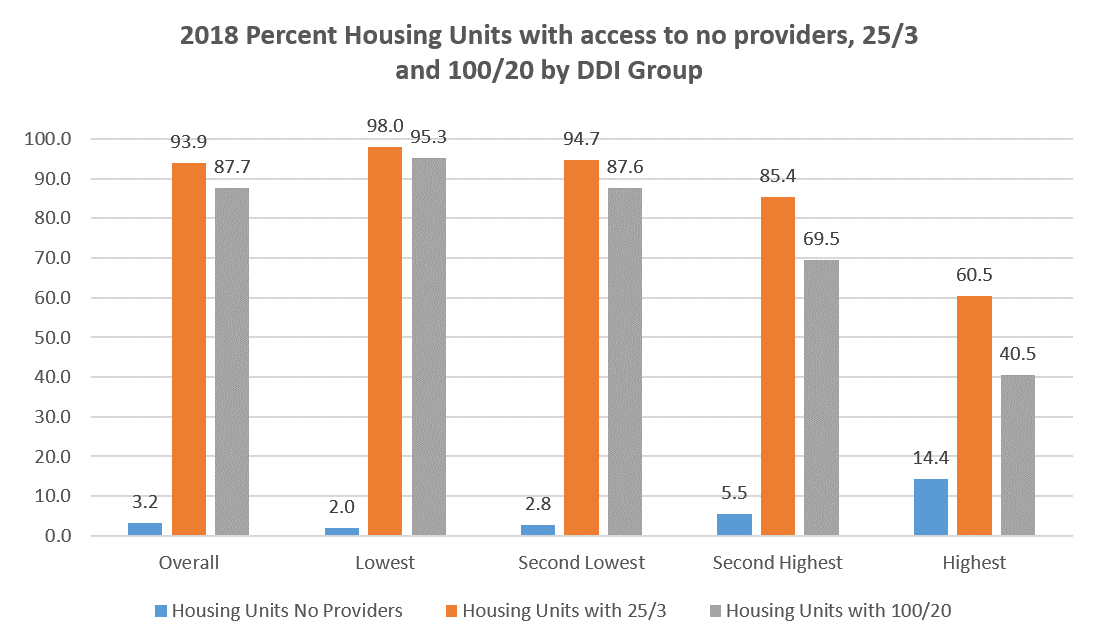
Source: PCRD; FCC Form 477
Moreover, counties with the highest digital divide had a higher share of households relying only on cellular data, no computing devices, and not accessing the internet at all. Overall, 8.8% of homes in the country relied only on cellular data to access the internet compared to 12.7% in counties with the highest digital divide. Research shows that relying solely on cellular data and/or mobile devices undermines the potential of technology to improve the users’ quality of life. On the other hand, close to 16% of homes did not subscribe to the internet in the country compared to close to one-third or 31.2% in high digital divide counties.
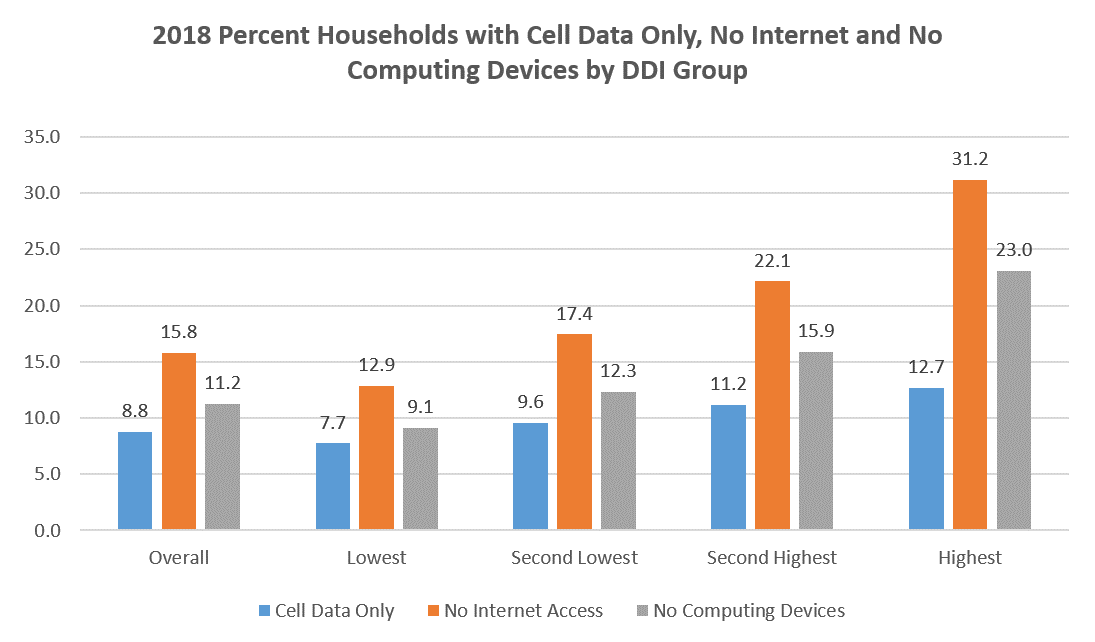
Source: PCRD; ACS 2014-2018
What are some socioeconomic characteristics of areas with a low or high digital divide?
Rural residents and less dense areas were most affected by the digital divide, as shown below. Overall, there were 34 households per square mile. However, this density was almost three times higher at 94.8 homes per square mile in counties with the lowest divide versus 4.9 in areas with the highest divide (orange line). Likewise, while close to one-fifth of residents lived in rural areas overall or 19.3% of the population, the rural share was 10.4% in counties with the lowest divide compared to a large rural share of 70.7% in areas with the highest divide.

Source: PCRD; ACS 2014-2018
Regarding median household income and the share of homes making less than $35,000, it is clear poorer households are most affected by the divide as well. The median household income overall was $61,397. However, the median income in counties (weighted by population) where the divide was the highest was $39,319 compared to $70,783 in areas with the lowest divide. Likewise, the share of homes making less than $35,000 was one-quarter in regions with the lowest divide compared to almost half or 45.4% in counties where the divide was highest.
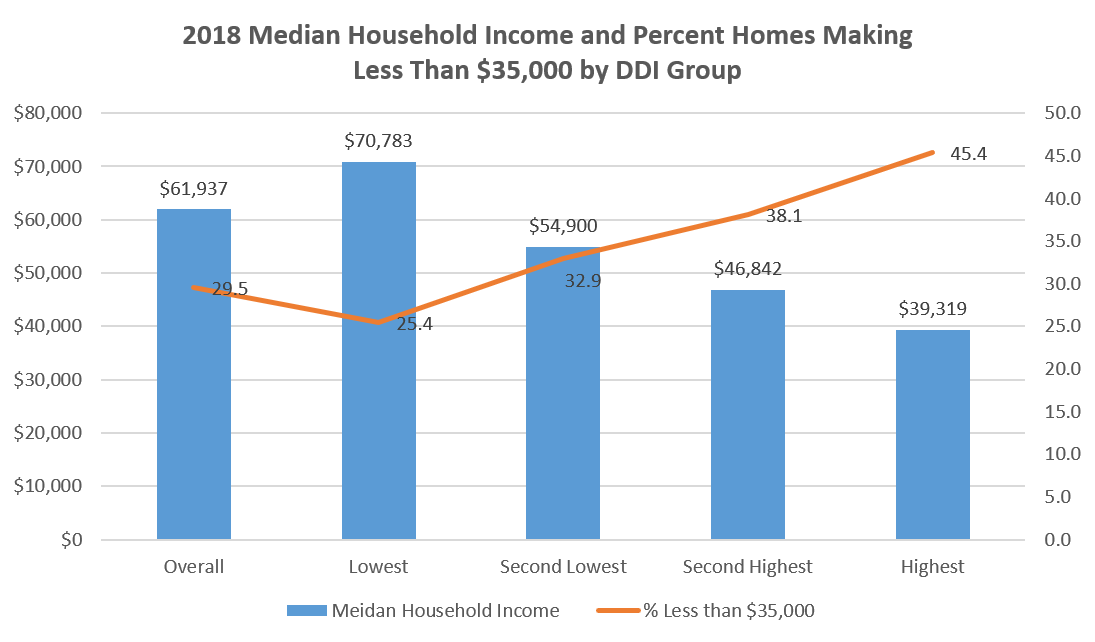
Source: PCRD; ACS 2014-2018
In regards to entrepreneurship (self-employed) and working from home—an increasingly feasible economic development alternative in areas where industrial jobs are lacking—counties with the highest digital divide had a lower share compared to areas with the lowest divide of both self-employed (10.1 versus 8.9%) and those working from home (6.5 versus 3.7%). This places these communities even further behind considering as well that the share of prime working-age population not in the labor force was much higher in areas with the highest digital divide compared to areas with the lowest divide (27 versus 18.1%).
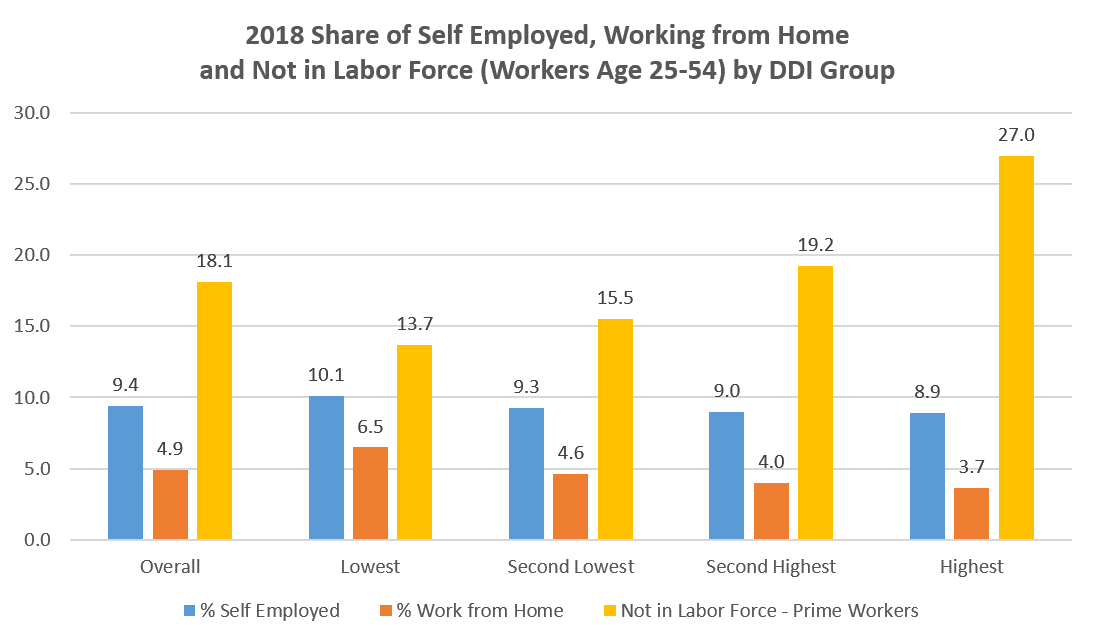
Source: PCRD; ACS 2014-2018
Last but not least, it is vital to take a look at the share of jobs requiring a certain level of digital skills (low, medium, and high) since the workforce and economy continue to digitize. The figure below shows that the share of jobs requiring high digital skills (gray bar) was ten percentage points lower in areas with the highest digital divide compared to areas with the lowest divide(20.9 versus 30.7%). Similarly, the overall share of digital economy jobs (based on 52 industries) of total jobs was 4% compared to 4.7% in counties with the lowest divide and only 1.7% in counties with the highest divide (not shown).
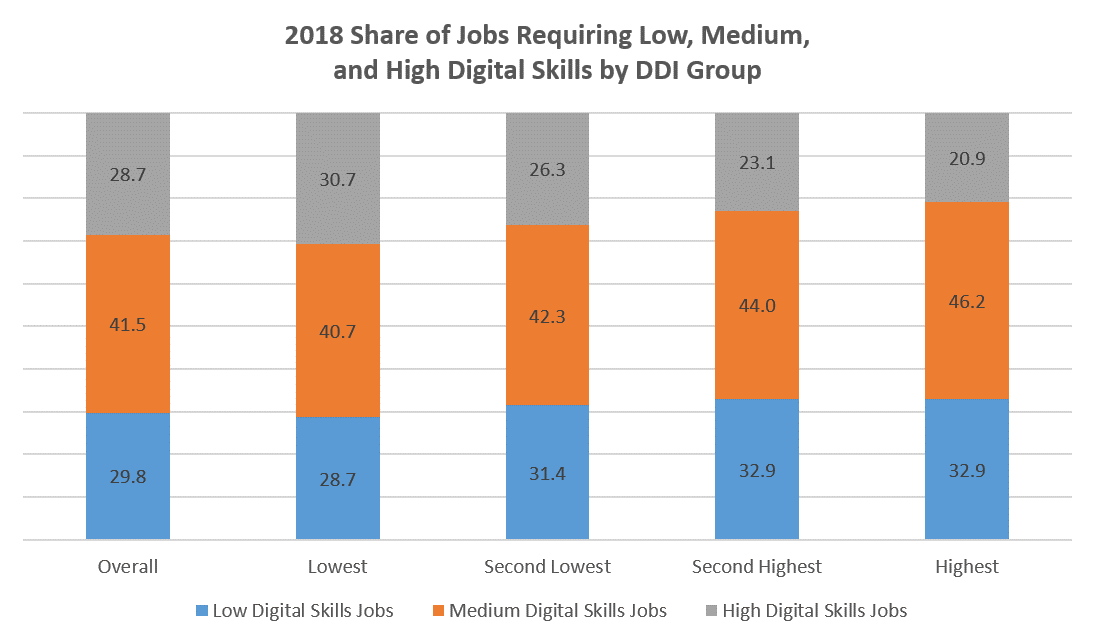
PCRD; EMSI; Brookings
Hopefully, this analysis sheds a bit more light into who is being affected by the digital divide, as measured by the DDI. Efforts need to be made to minimize this divide. All hands on deck are needed. Digital inclusion efforts, which address not only connectivity but skills/relevance and devices, are a must in any community economic development strategy.
Otherwise, areas already struggling will continue to fall behind as they remain on the wrong side of the divide in an increasingly evolving digital economy and society.

Roberto Gallardo is the Vice President for Engagement and an Associate Professor in the Agricultural Economics Department. He holds an electronics engineering undergraduate degree, a... read more