A Look at Home Internet Adoption and Income

In a January article we looked at several variables related to household internet and devices to better understand Indiana’s digital landscape. Results showed that the share of households with no internet access decreased across its urban, suburban, and rural areas. On the other hand, the share of households with only mobile devices or no computing devices at all decreased also across its urban, suburban, and rural areas.
In other words, the digital divide—measured by household internet access and devices—became narrower in Indiana between 2017 and 2022. This is great news for the state’s quality of life!
Today, we look at household internet subscriptions and income. The U.S. Census publishes number of households by multiple income categories as well as the number without an internet subscription. While the data does not tell us why the household does not have an internet subscription (e.g., cost, availability, etc.), it does shed light on household internet adoption.
Research continues to show that positive socioeconomic effects take place only after adopting broadband, not with mere availability. For this reason, it is important to untangle home internet subscriptions and income to ensure everybody can benefit from internet adoption. Moreover, this knowledge is important as the state is working to ensure households adopt internet regardless of income.
Like the January article, three rurality categories were used: urban, suburban, and rural shares in Indiana and the nation were calculated by aggregating 2020 Decennial population to the tract level and then labeled accordingly. For example, a tract was deemed urban if less than 25% of its 2020 population lived in rural areas; suburban if between 25 and 75% of its population lived in rural areas; and rural if more than 75% of its population lived in rural areas.
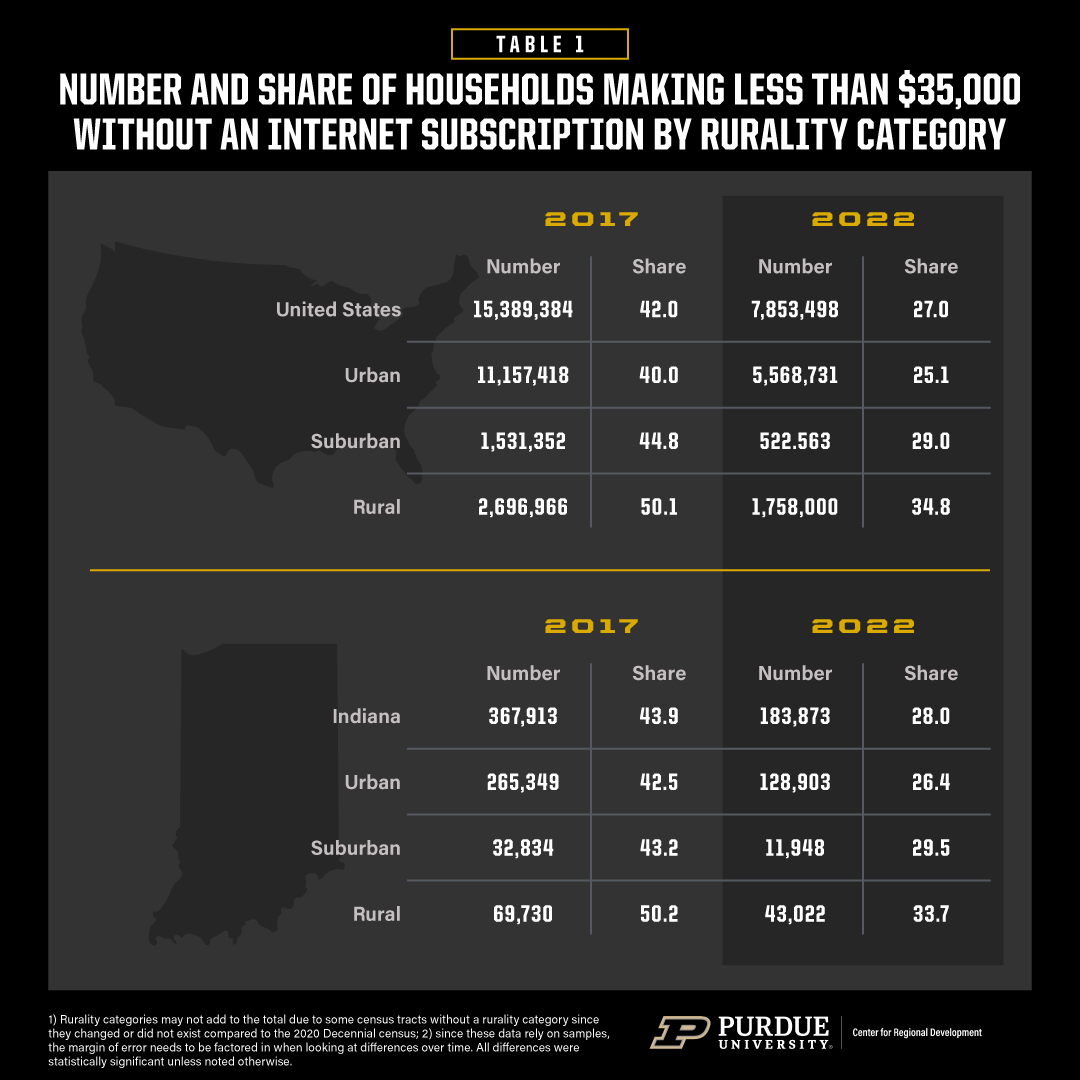
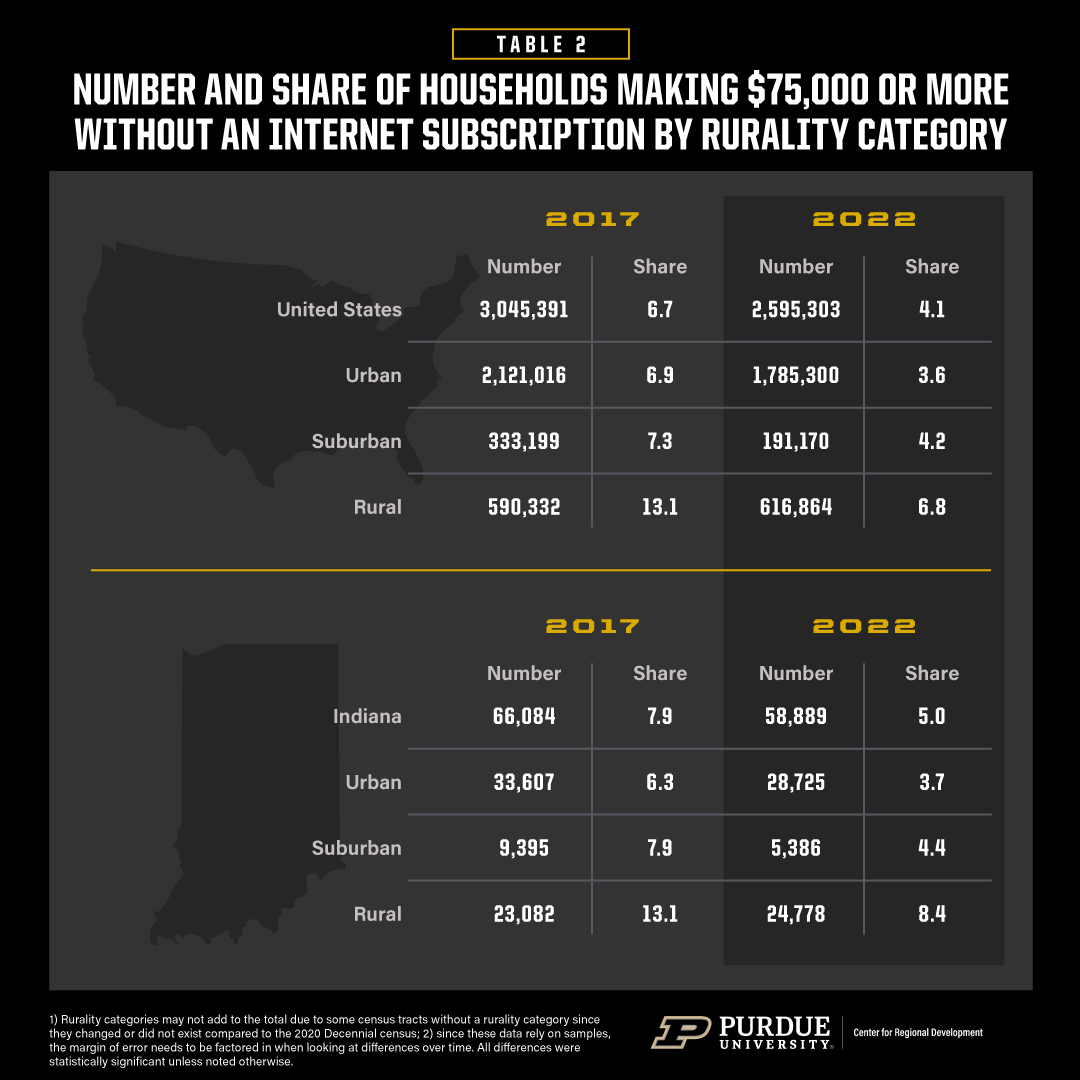
Tables 1-2 show the U.S. and Indiana urban, suburban, and rural areas and their shares of households making less than $35,000 (lower income) and $75,000 (higher income) or more without an internet subscription in 2017 and 2022. Several insights are worth discussing. First, the share of lower and higher income households without an internet subscription decreased across urban, suburban, and rural areas of the state and nation, though the decrease was higher in lower income households.
Second, the share of rural households is higher compared to urban and suburban regardless of income category depicting a clear urban-rural divide. For example, the share of rural lower income households in Indiana in 2017 without an internet subscription was 50.2% compared to 42.5% in urban areas of the state. The same trend is seen in higher income households where the share of those in rural areas without an internet subscription in 2017 was 13.1% compared to 6.3% in urban areas of the state.
Third, the share of lower income households without an internet subscription is higher compared to the share of higher income households regardless of rurality category or year, clearly depicting a class divide. For example, the share of lower income households without an internet subscription in rural Indiana in 2017 was 50.2% decreasing to 33.7% in 2022 compared to 13.1% in 2017 and 8.4% in 2022 for higher income households.
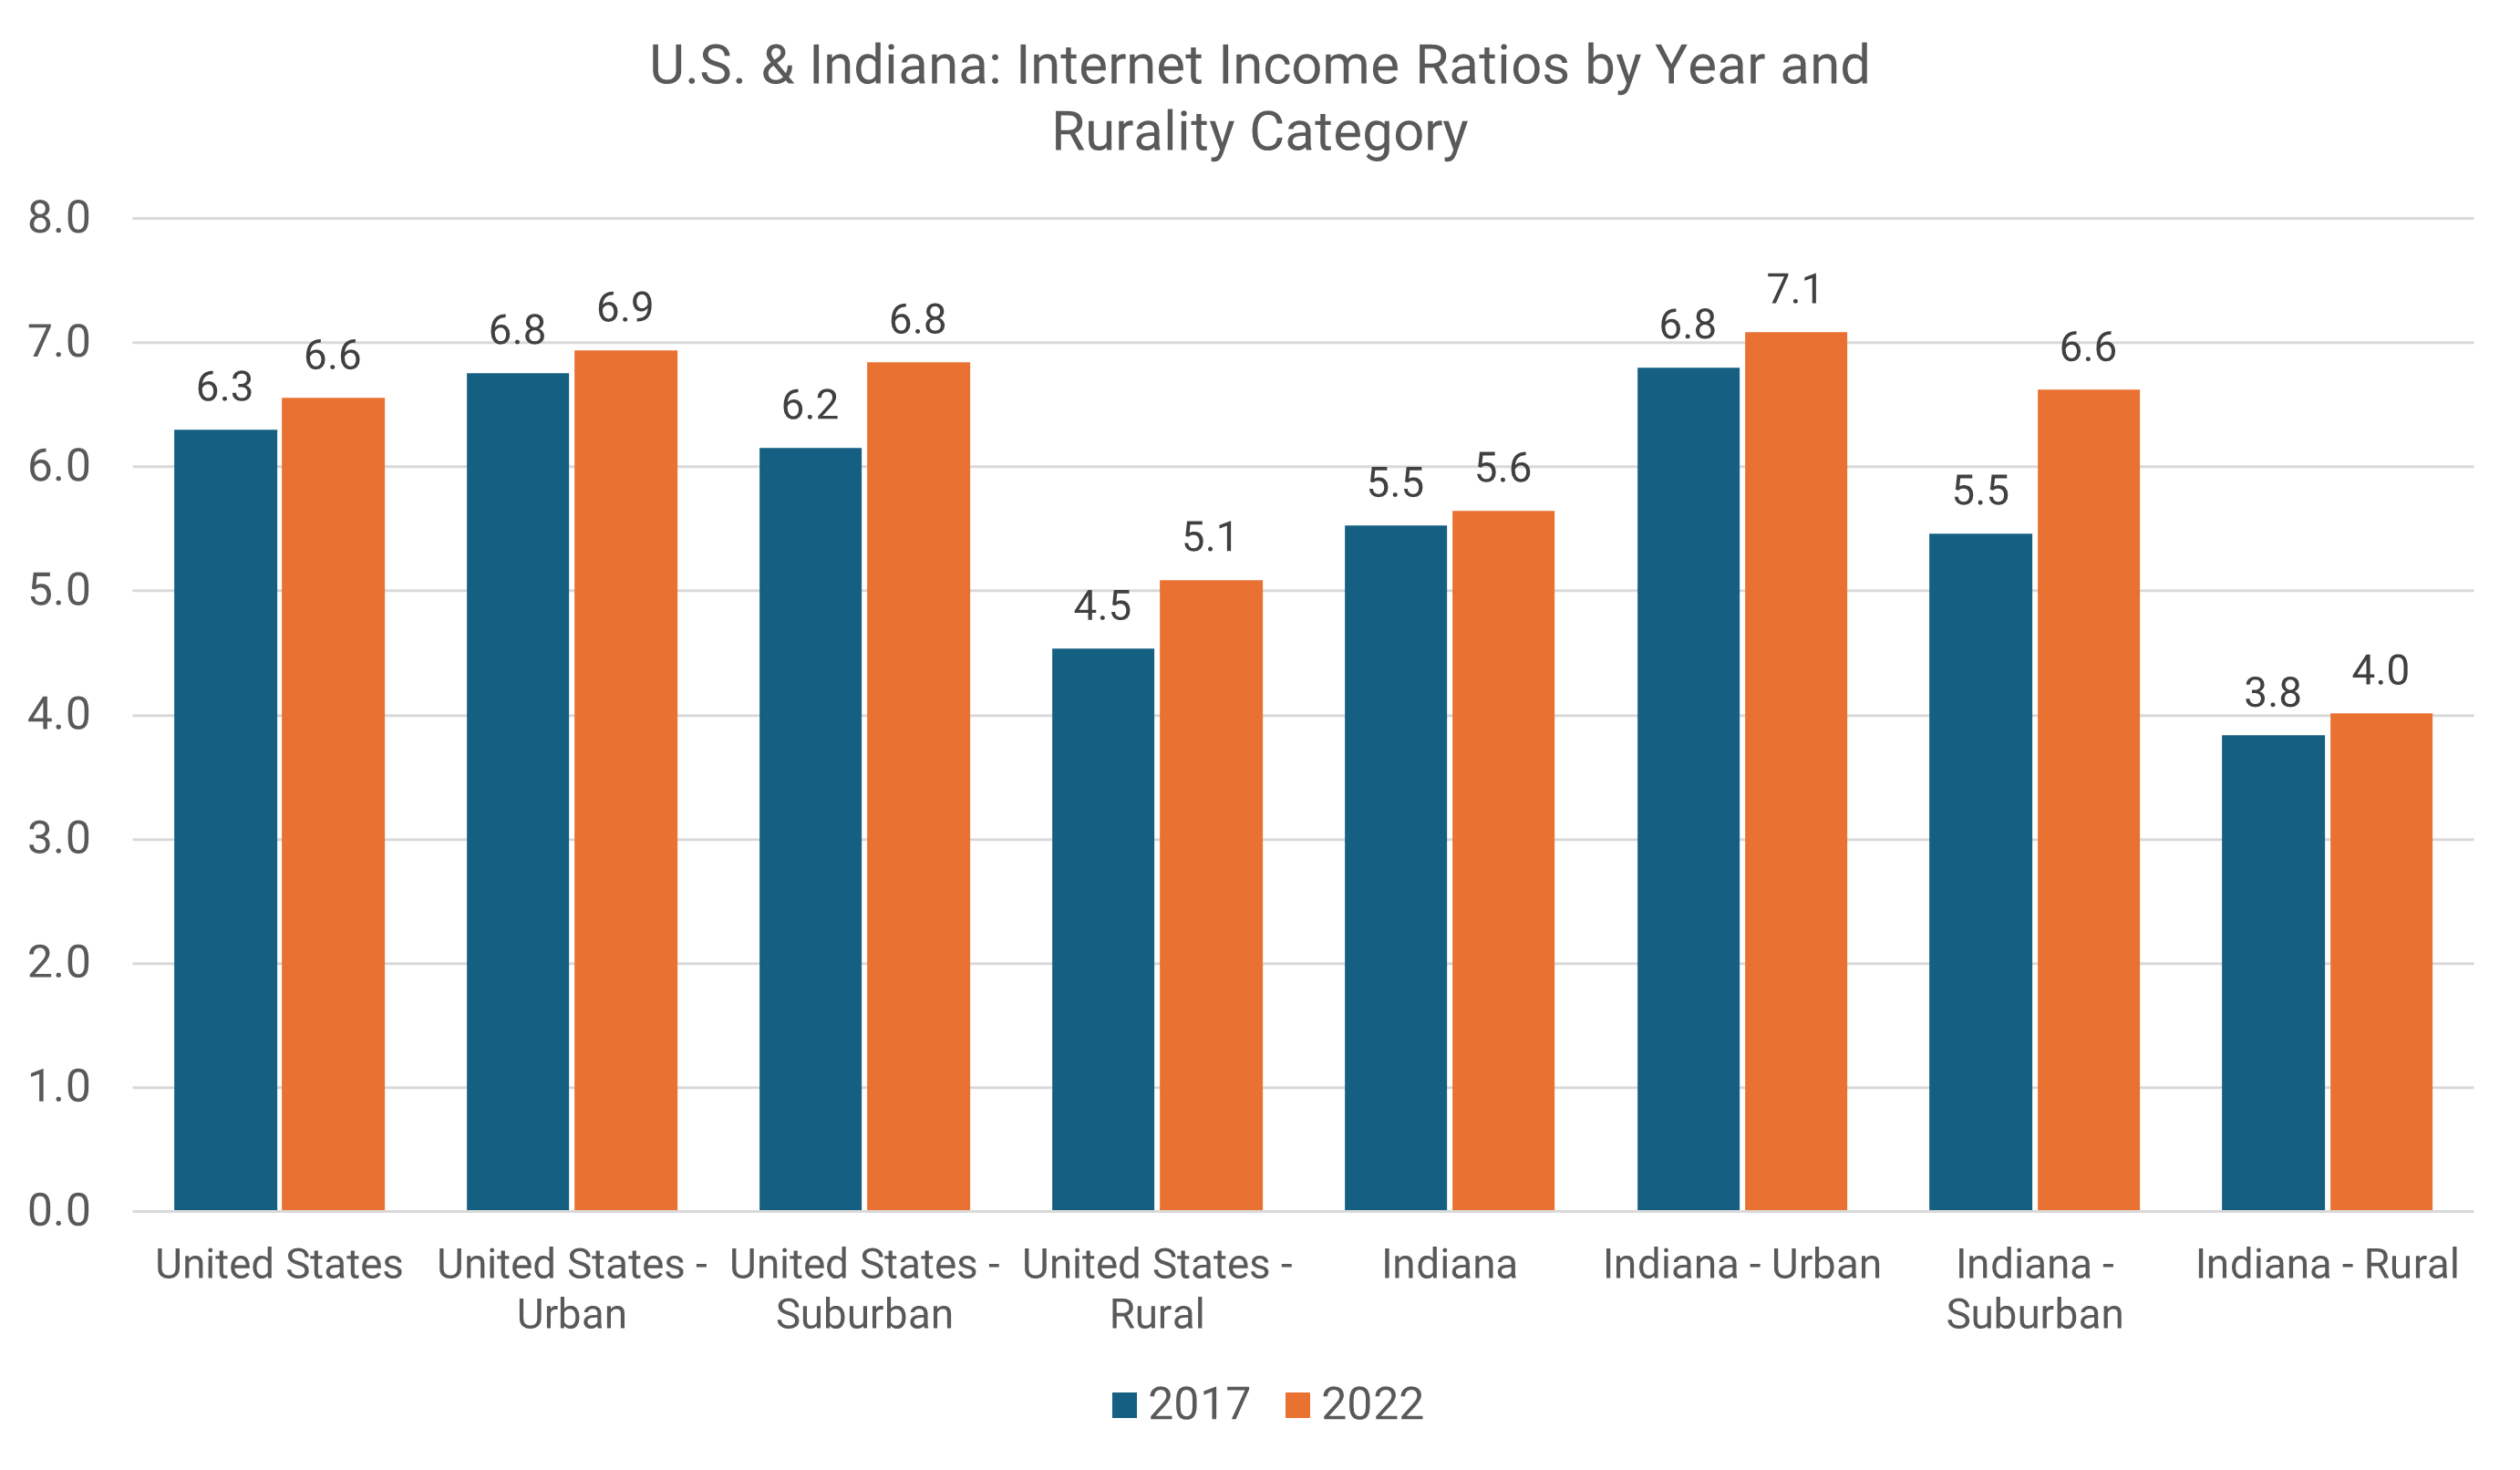
We calculated another variable called the Internet Income Ratio or IIR. The IIR divides the share of lower income households with no internet subscriptions by the share of higher income households. The result is a ratio that is one way to measure if inequality is increasing or decreasing. If the IIR is higher, inequality is increasing.
The chart below shows the IIR for all rurality categories in the U.S. and Indiana for 2017 & 2022. In the U.S. in 2017, the share of lower income households without an internet subscription was 6.3 times higher compared to the higher income share. By 2022, this number increased to 6.6. Suburban Indiana experienced the highest increase between 2017 and 2022 while urban areas in Indiana had the highest IIR in 2022.
As shown, the IIR increased across all rurality categories in the U.S. and Indiana, more so in suburban areas. In other words, despite decreases (improvements) in the share of households without an internet subscription regardless of income and rurality area, inequality between these two income variables increased.
While the efforts to reduce the share of lower and higher income households without internet subscriptions are paying off in the nation and Indiana, additional efforts need to be made to ensure that lower income households adopt internet at the same rate as urban. As shown in this analysis, lower income households are falling behind. Home internet cost subsidies, digital literacy availability, and community-level technical support can help.
To conclude, the interactive table (sort columns in ascending/descending order; search by county name; scroll left and right to see all variables; advance page for more counties) and map (hover over a county to see variables) below showcase Indiana counties their Internet Income Ratio or IIR as well as their share of lower and higher income households with no internet subscriptions and 2022 rural population. The lower income (LI) and higher income (HI) statistical significance difference is also included, where a “Yes” means that the difference was statistically significant between 2017 and 2022.
Based on the map, groups of counties with a high (34.4% or higher) lower income share of households without an internet subscription is visible in the central, northwest, and northeast parts of the state.
Using the interactive table we can see that in 2022 the Indiana county with the highest share of lower income households without an internet subscription was Harrison County with 49.7% while LaGrange County had the highest share of higher income households without an internet subscription with 35.6%. Regarding the IIR, Hamilton County had the highest in the state in 2017 with 11.4 while Hancock County had the highest IIR in 2022 with 13.8.

Roberto Gallardo is the Vice President for Engagement and an Associate Professor in the Agricultural Economics Department. He holds an electronics engineering undergraduate degree, a... read more