Exploring Skills’ Characteristics of the U.S. Occupations

Written by: Indraneel Kumar, Karen Ivanna Siller, Andrey Zhalnin, Ben St. Germain, and Bertin Mbongo.
This article explores the skills’ characteristics of occupations by using the O*Net (Occupational Information Network) databases for the U.S. The purpose is to understand the skills’ characteristics of individual occupations for the U.S. The industries and occupations present two complementary views of the regional economy as elucidated by Feser (2003) in “What Regions Do Rather than Make?”.1 Industries show the production side of the economy, whereas occupations show the job activities of the labor force including workers engaged in those industries. “Labor” is an important factor of production for a regional or a national economy. For example, the Cobb-Douglas production function uses “labor,” “capital,” and a “technology” coefficient as the factors for the economic output.2 The labor force and workers generally represent the human capital because of their education, knowledge, skills, abilities, and expertise. The availability of a skilled labor force is an important parameter for new businesses and industries searching for development sites in communities and regions. The endogenous growth theory also states that economic growth could result from internal processes within the economy because of innovations in technology, products, and processes.3 The occupations and their characteristics such as knowledge and skills represent the human capital aspects of the regional economy. Hence, quality of the human capital becomes important for regional and national economic growth.
Similar to industry clusters, occupation clusters are groups of occupations sharing some common characteristics such as education, training, skills, etc. O*Net is an occupational program sponsored by the U.S. Department Labor and Employment and Training Authorization.4 The O*Net collects data about occupations, especially knowledge, skills, and abilities needed to perform different tasks, duties, and responsibilities required for a particular job.5 As part of the program, O*Net also provides career planning web-based tools such as My Next Move6 for the general population and My Next Move for Veterans7, and other information8 for state, local, and nonprofit workforce development departments and agencies. Currently, the O*Net database is at version 28.3, and it has as many as 873 different types of occupations which varies from helpers (brick masons, roofers, etc.) and clergy to climate change policy analysts. The O*Net compiles occupational descriptors of knowledge, skills, and abilities comprised of several hundred variables that enable the analysis of occupations from different perspectives.
O*Net collects information on the level and importance of 35 different types of skills that are divided into seven groups. For example:
- Content group includes skills such as reading comprehension;
- Process group includes skills such as active learning;
- Social group includes skills such as negotiation;
- Complex problem-solving group includes the complex problem-solving skills;
- Technical group includes skills such as programming;
- Systems group includes skills such as judgment and decision making; and
- Resource management group includes skills such as time management.
In total, data for 70 skill variables inclusive of 35 levels and 35 importance are provided for each of the 873 occupations. The amount of a particular skill needed in an occupation or a job is shown by “level,” which varies from 0 (minimal or nonexistent) to 7 (proficient/expertise). The degree of requirement of a particular skill in an occupation is shown by “importance,” which varies from 1 (not important) to 5 (extremely important).
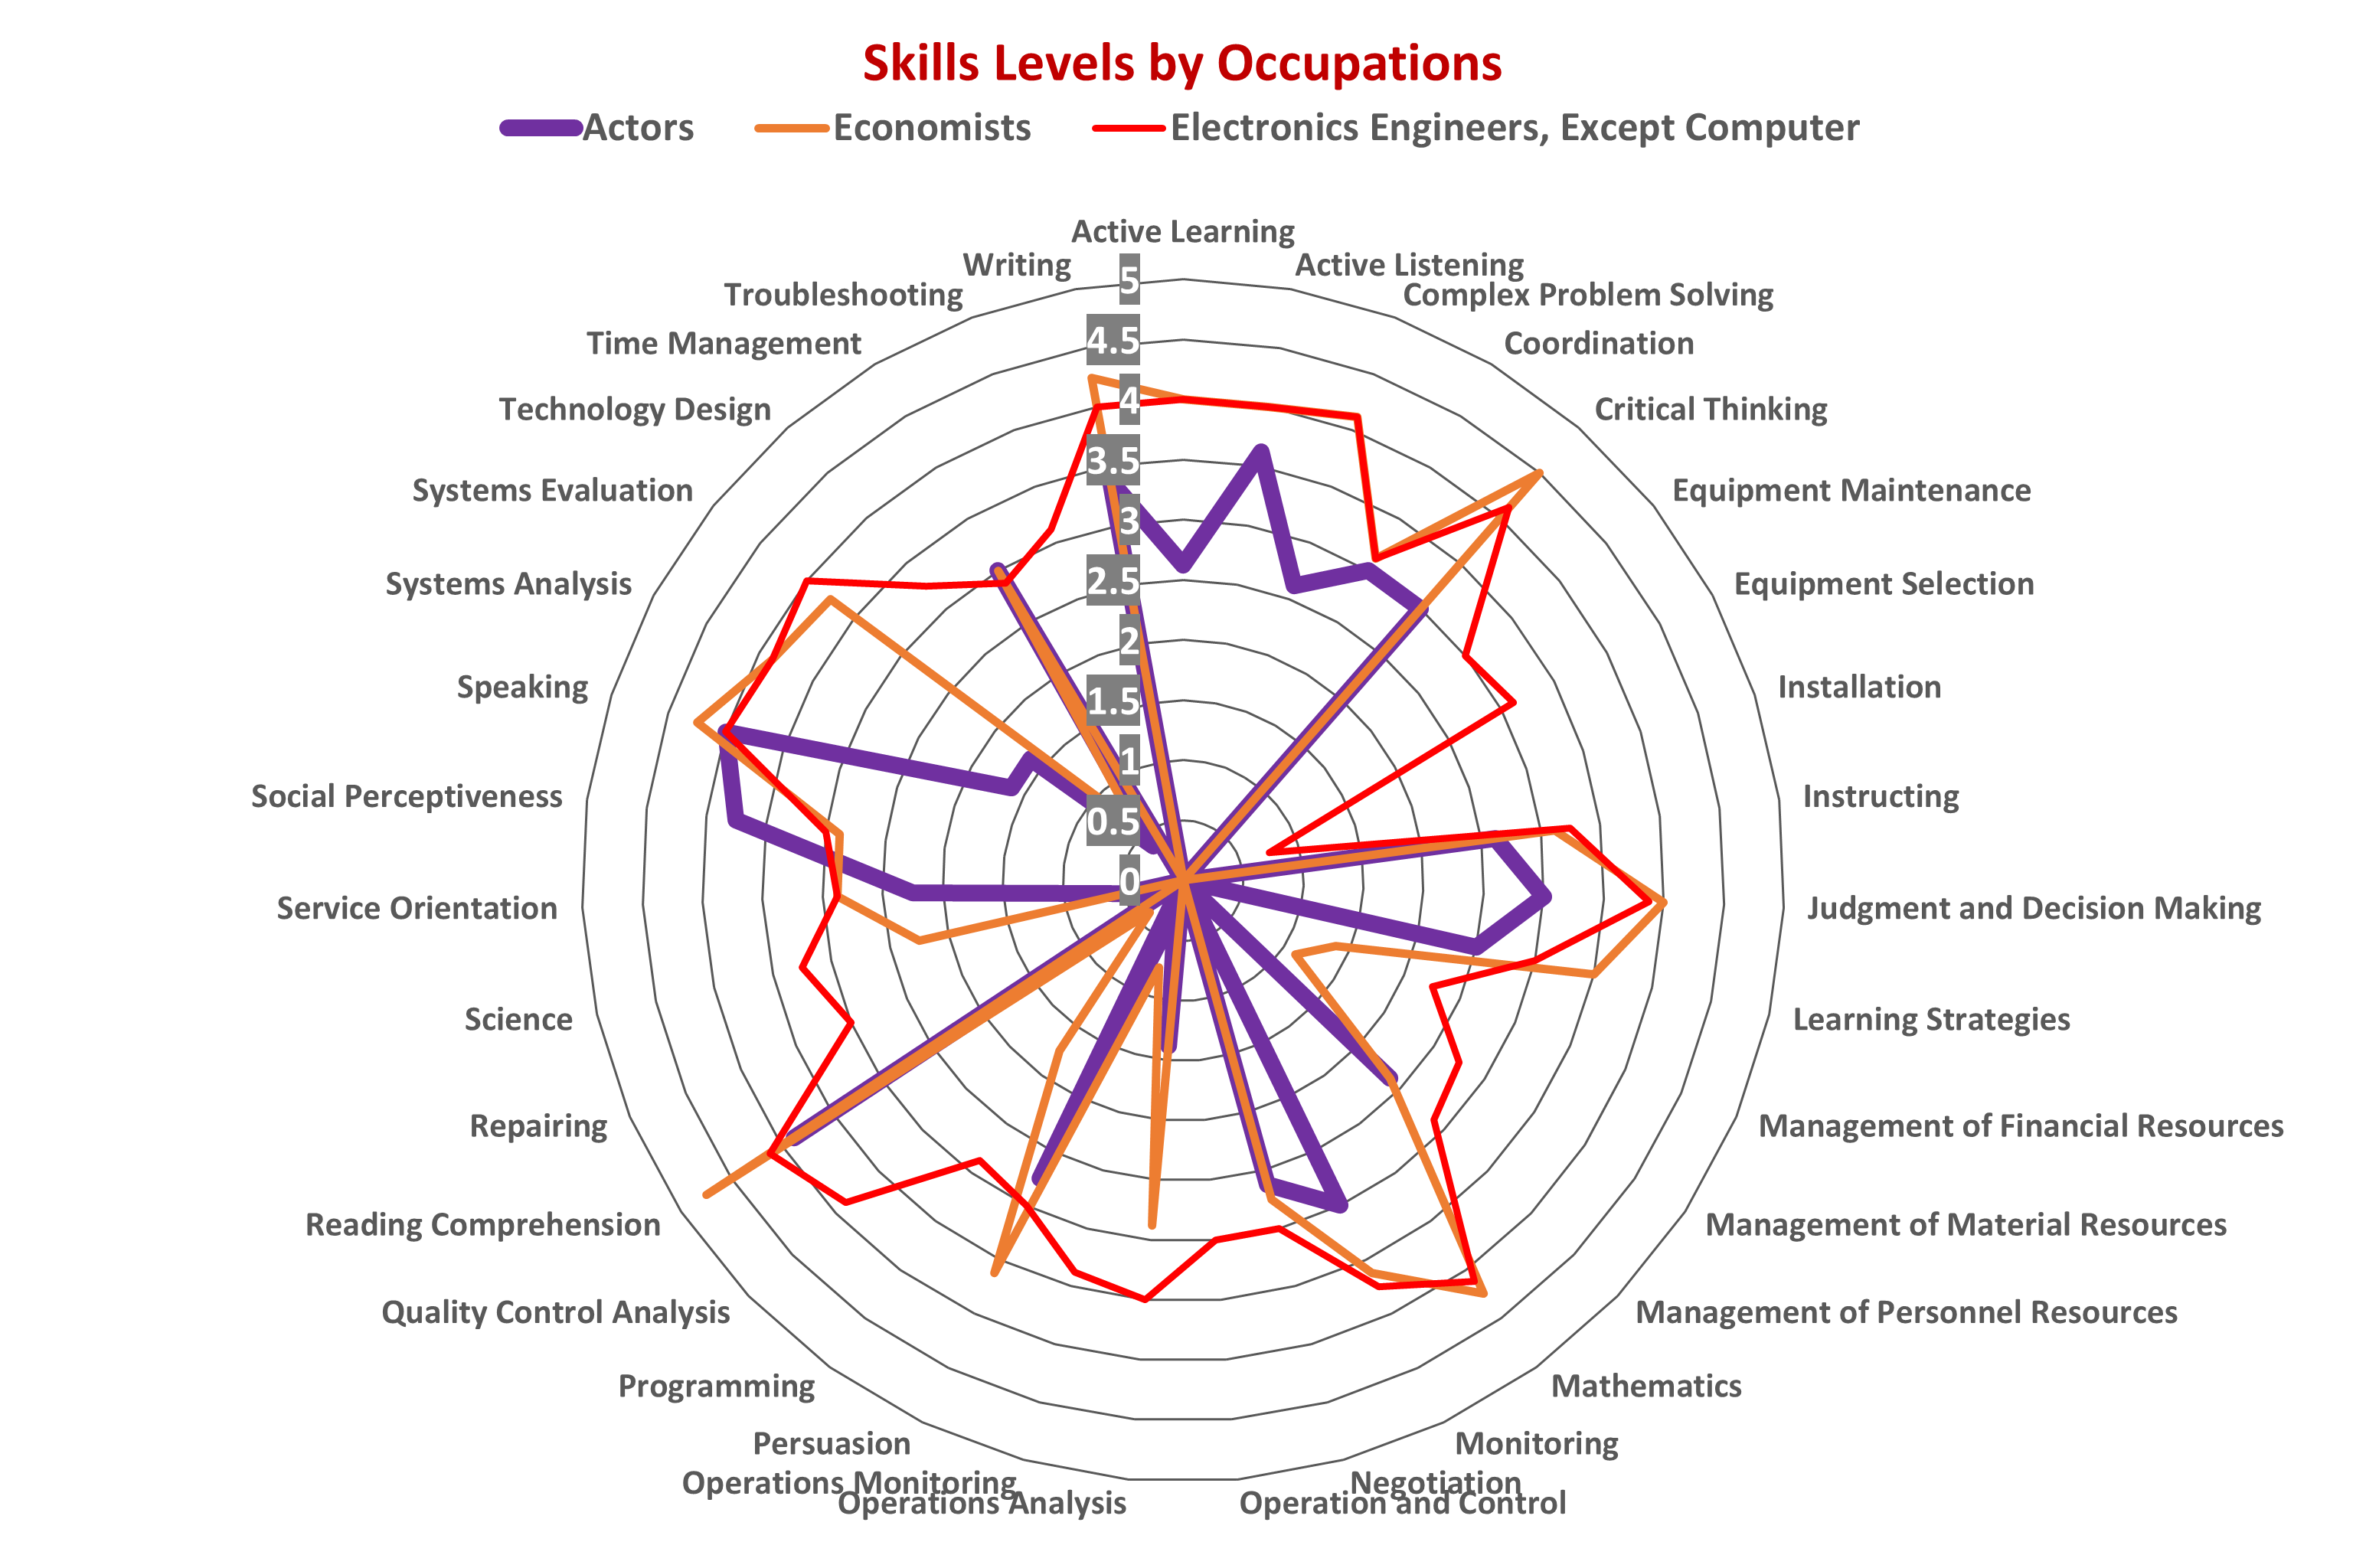
Figure 1 shows comparisons of 35 skill levels in three different occupations—actors, economists, and electronics engineers except computer. An economist requires higher levels of critical thinking and mathematical skills than an actor. An electronics engineer needs higher levels of equipment maintenance, equipment selection, and installation skills than economists or actors. The Radar Chart in Figure 1 visualizes the skill-level profiles of individual occupations, compiled by the O*Net program.
Occupations by Skill-Levels (Content Characteristics)
The Content group, one of the seven groups of skills, includes active listening, mathematics, reading comprehension, science, speaking, and writing skills. The levels of these skills across various occupations are displayed in the table below. For example, Accountants and Auditors require a Mathematics skill level of 4.00, while Actors need a minimal or 0.00 level of Mathematics.
Occupations by Technical Skills-Levels
The Technical group contains 11 skills, which are equipment maintenance, equipment selection, installation, operation and control, operations analysis, operations monitoring, programming, quality control analysis, repairing, technology design, and troubleshooting. The radar chart below compares occupations by their technical skill levels, illustrating distinct technical skill-level profiles for different occupations.
Occupations by Process Skills-Levels
The Process group includes four skills: active learning, monitoring, learning strategies, and critical thinking. The “radar chart with rings” visualization below provides insights into how different occupations utilize these process-related skills.
Engineering Occupations by Content Skills-Levels
A specific visualization focusing on engineering occupations using the Content group skill levels is provided in the radar chart below. This interactive chart allows users to view the skill levels for each engineering occupation separately, as well as in a combined form.
The descriptive statistics of 35 different skill-levels and skill-importance are shown in Table 1 and 2, respectively. The coefficient of variation (CV)9 for skill-levels is 52.9%. Similarly, the CV for skill-importance is 33.6%. The CV shows that the skill-levels values have more variations across 873 occupations compared to the skill-importance values. Similarly, the inter quartile range (IQR)10 for skill-levels is 1.75 and IQR for skill-importance is 1.12. Clearly, the range of skill-levels data are higher than the skill-importance data. The variation and range statistic show that skill-levels data are heterogenous and more dispersed, and hence suitable for further analysis compared to the skill-importance data that are more homogenous. The descriptive statistics also point to the direction that skill-levels data can capture the variations and differences between occupations better than the skill-importance.
Table 1: Descriptive Statistics of Skill-levels Data by Occupations
| Descriptive Statistics Skill Levels | Value |
|---|---|
| Average | 2.38 |
| Max | 6.00 |
| Min | 0.00 |
| Std. Deviation | 1.26 |
| 3rd Quartile | 3.25 |
| 2nd Quartile | 2.62 |
| 1st Quartile | 1.50 |
Table 2: Descriptive Statistics of Skill-Importance Data by Occupations
| Descriptive Statistics Skills Importance | Value |
|---|---|
| Average | 2.59 |
| Max | 5.00 |
| Min | 1.00 |
| Std. Deviation | 0.87 |
| 3rd Quartile | 3.12 |
| 2nd Quartile | 2.75 |
| 1st Quartile | 2.00 |
The 873 x 35 occupations by skills data becomes incomprehensible in raw form for workforce development and policy analysis purposes. If occupations are clustered and grouped by similarity of skill-levels, it could become comprehensible and useful for planning applications. The skills-based occupation clusters could be useful to determine career pathways and career ladders including vertical and lateral career movements and transitions undertaken by workers and professionals. Such data can be useful for the Human Resource (HR) departments of industries and businesses. Hence, defining the occupation clusters and compiling the data for different definitions are the logical next steps for this research. Note that occupations identified by O*Net are not directly comparable to the occupations included in SOC (Standard Occupation Codes), however the O*Net to SOC Taxonomy11 information is available for research purposes and public use.
In the current labor market, skills have become important as employers have been valuing skills more than educational attainment. Hence, badges and micro-credentials and online certifications are valued to become competitive in the job market. Occupation clusters by skills can highlight groups of occupations that are similar in terms of hard-and-soft skills. Also, the inventory of skills is increasing day-by-day as employers seek advanced skills in computer science, artificial intelligence, etc. There are opportunities to develop occupation clusters focused on technical skills. Stay tuned for the upcoming articles and policy insight articles on this topic.
Disclaimer
This article is prepared by Purdue Center for Regional Development using Federal funds under award #ED23RNA0G0174 from the Economic Development Administration, U.S. Department of Commerce. The statements, findings, conclusions, and recommendations are those of the coauthors and do not necessarily reflect the views of Economic Development Administration or the U.S. Department of Commerce.
Footnotes
- Feser, Edward. 2003. What regions do rather than make: A proposed set of knowledge-based occupation clusters. Urban Studies. Vol. 40, Issue 10, pp. 1937-1958.
- https://spureconomics.com/cobb-douglas-production-function/
- https://www.brown.edu/Departments/Economics/Faculty/Peter_Howitt/publication/endogenous.pdf
- https://www.onetcenter.org/
- https://www.onetcenter.org/overview.html
- https://www.mynextmove.org/
- https://www.mynextmove.org/vets/
- https://www.onetonline.org/
- Coefficient of variation or CV=σ⁄μ×100. It is the ratio of standard deviation to the mean multiplied by 100.
- Inter quartile range (IQR) is Q3 (Quartile 3) minus Q1 (Quartile 1).
- https://www.onetcenter.org/taxonomy.html

Indraneel Kumar is the Director for the Purdue Center for Regional Development (PCRD). Indraneel has been at PCRD since its inception in 2005. He focuses... read more