Internet Subscriptions and Access
The Census Bureau released last week 2013-2017 five-year estimates of multiple socioeconomic characteristics, including household with internet subscriptions and computing devices. To further understand an Indiana urban-rural digital divide, census tract or neighborhood level data was analyzed.
This analysis utilized a modified version of a Census designed urban-rural categories: completely urban, where less than one percent of the population was considered rural; mostly urban, where less than 50 percent of the population was considered rural; mostly rural, where 50 to 98 percent of the population were considered rural; and completely rural, where 99 percent or higher of the population was rural.
The map below shows Indiana neighborhoods by urban/rural type.
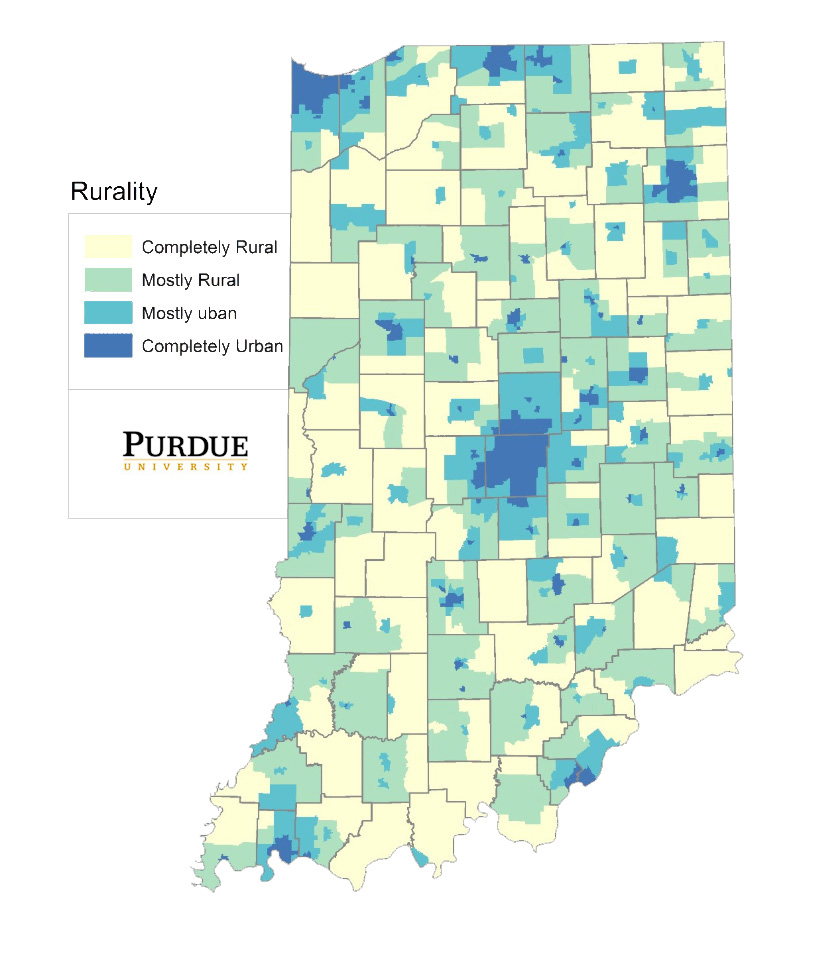
State’s population as of 2017 was estimated at 6.61 million of which almost half or 48.2 percent lived in completely urban neighborhoods versus almost 13 percent in completely rural neighborhoods.
| 2017 Population | Number | Percent |
|---|---|---|
| Indiana | 6,614,418 | 100.0 |
| Completely Urban (<1% rural) | 3,123,484 | 48.2 |
| Mostly Urban (<50% rural) | 1,694,125 | 26.1 |
| Mostly Rural (50-98% rural) | 832,064 | 12.8 |
| Completely Rural (99% or more rural) | 834,124 | 12.9 |
Source: 2013-2017 ACS 5-Year Estimates
According to the recently released data, three-quarters of Hoosier households subscribed to broadband (any internet connection except for dial-up, including cellular data and satellite regardless of speed) versus 74.7 percent in completely urban neighborhoods and almost 69 percent in completely rural neighborhoods.
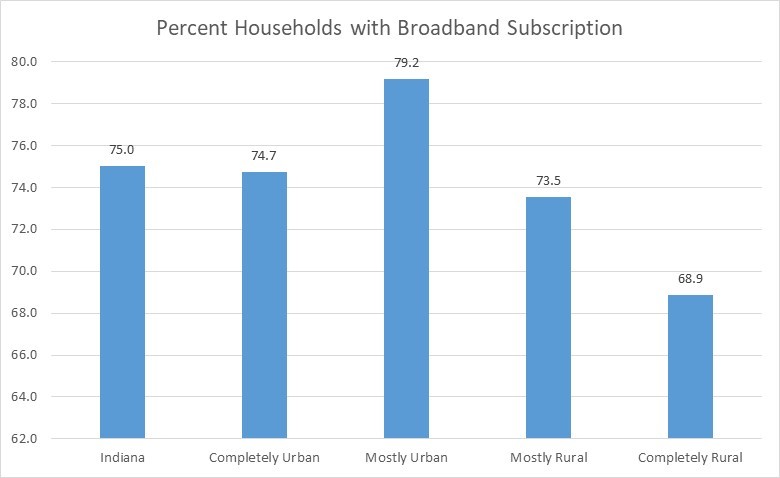
Source: 2013-2017 ACS 5-Year Estimates
However, when breaking down by type of broadband technology (regardless of speed), the figure below shows the percent of households with a wireline—cable, fiber, or DSL—subscription. Note that the difference between completely urban/rural is 20 percentage points.
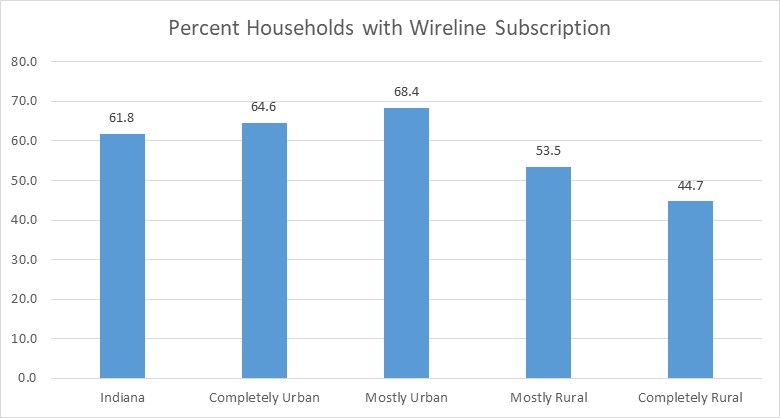
Source: 2013-2017 ACS 5-Year Estimates
In addition, research shows that households that rely more on cellular data are at a disadvantage due to limited data plans. Note that a higher percent of completely rural households or 12.3 percent subscribed to broadband only through their cellular data plans compared to 7.9 of completely urban households.
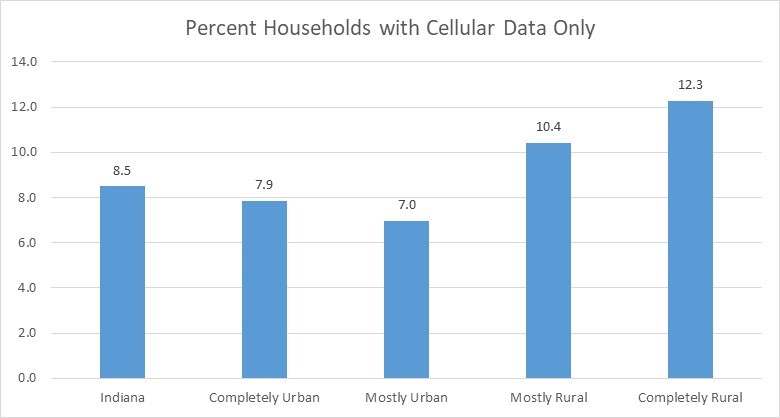
Source: 2013-2017 ACS 5-Year Estimates
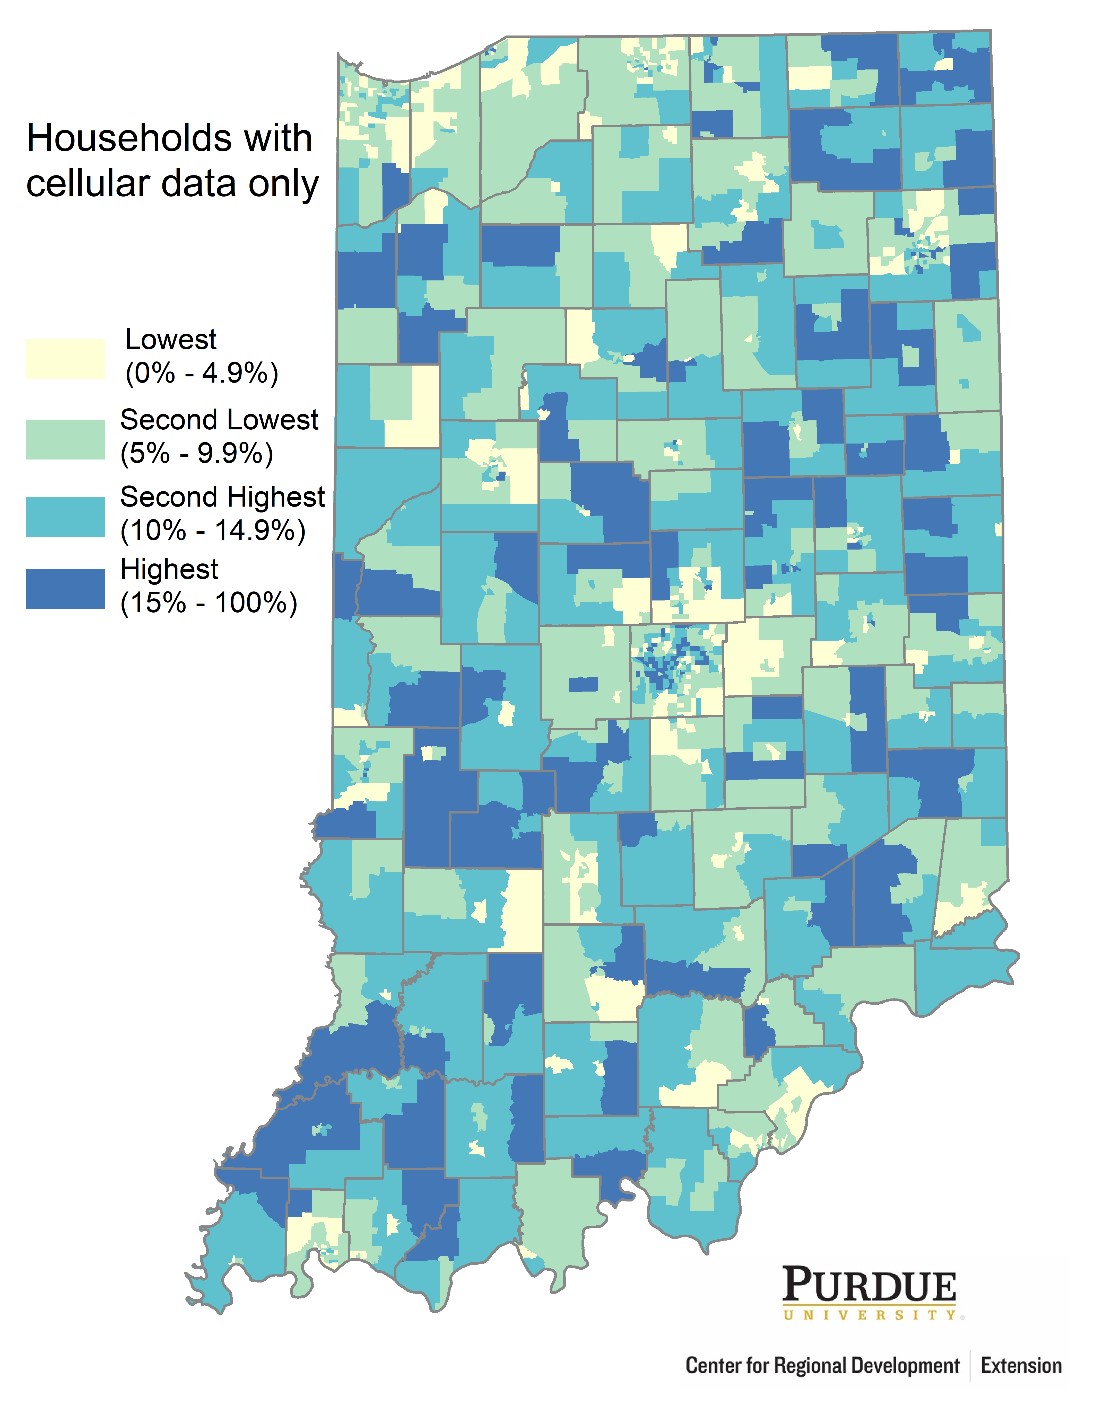
The map below shows neighborhoods analyzed divided into four equal groups or quartiles that relied solely on cellular data internet connections. Note how darker tracts, or those in the highest quartile, are seen all over the state, including inner-city neighborhoods in Indianapolis.
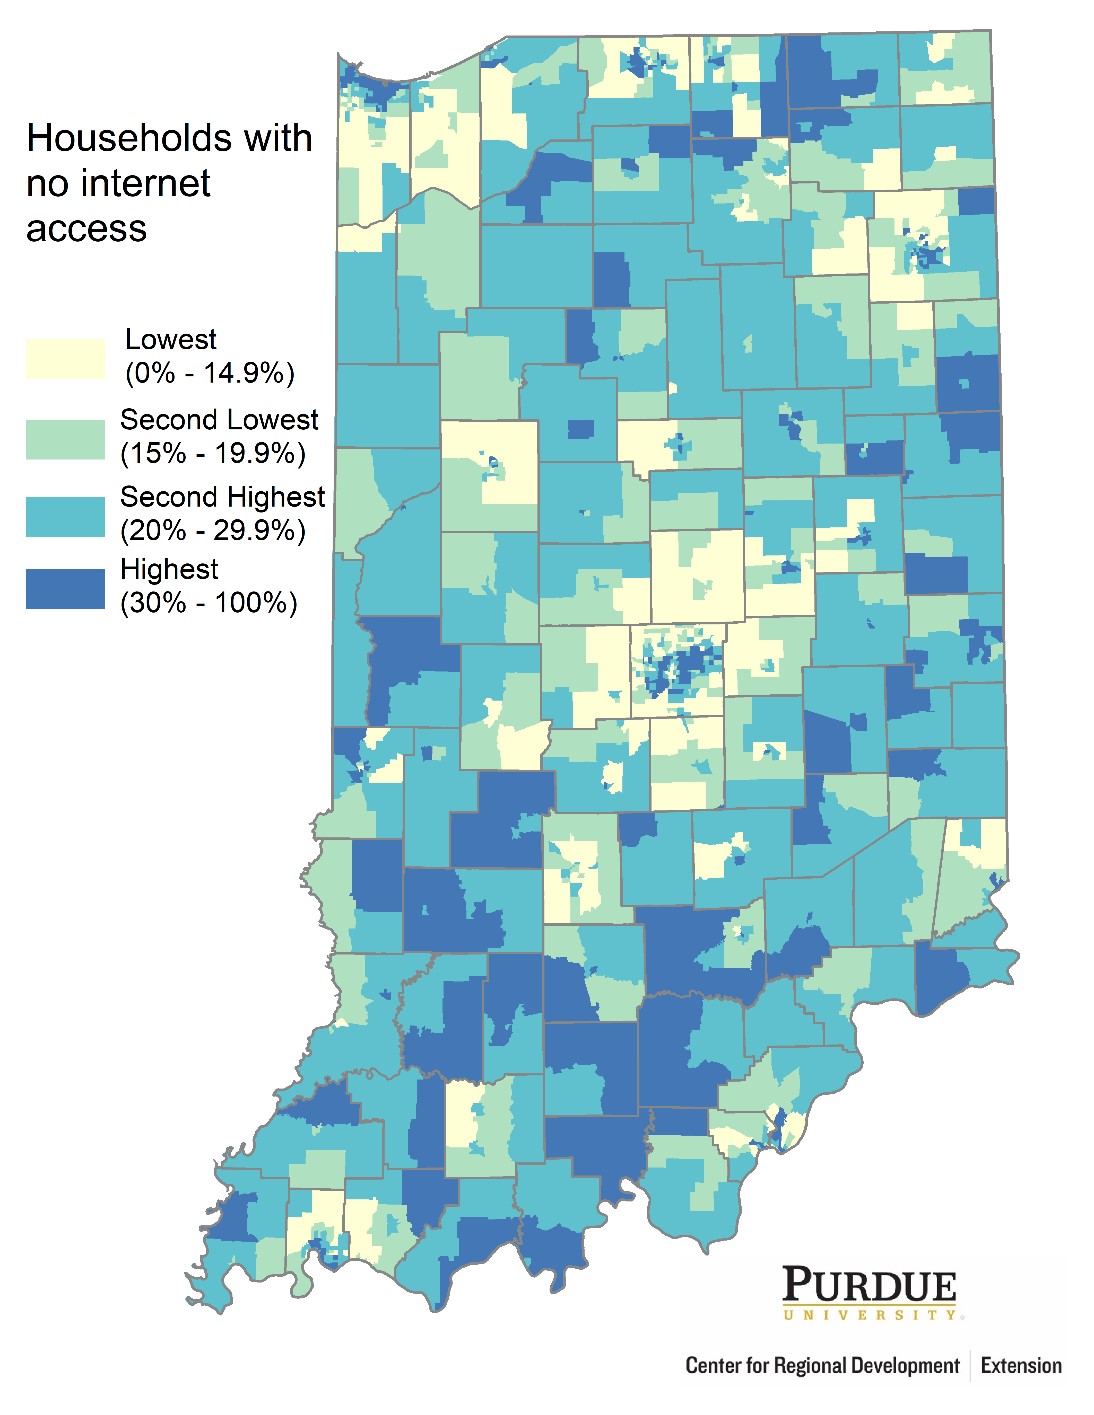
Regarding internet access in general, one-quarter of Hoosier households in completely rural neighborhoods had no internet access compared to one-fifth of homes in completely urban areas as shown in the figure below. Overall, one-fifth of Hoosier homes did not have access to the internet according to the latest Census figures.

Source: 2013-2017 ACS 5-Year Estimates
Again, the map below shows four equal groups of neighborhoods based on the percent of households with no internet access. Note how the south-southwest portion of the state has a larger share of dark blue (highest quartile) neighborhoods.
Access to computing devices is critical to fully participate in this digital age aside from internet connectivity. Research shows that homes that rely mostly on mobile devices are at a disadvantage due to screen size and lack of a keyboard. For example, try completing an online job application or school term paper using only your smartphone.
The graph below shows the percent of Hoosier households with only mobile (tablets, smartphones, etc.) computing devices. Note how the share of completely urban/rural is the same. In other words, there is no digital divide between urban and rural when it comes to relying solely on mobile computing devices.
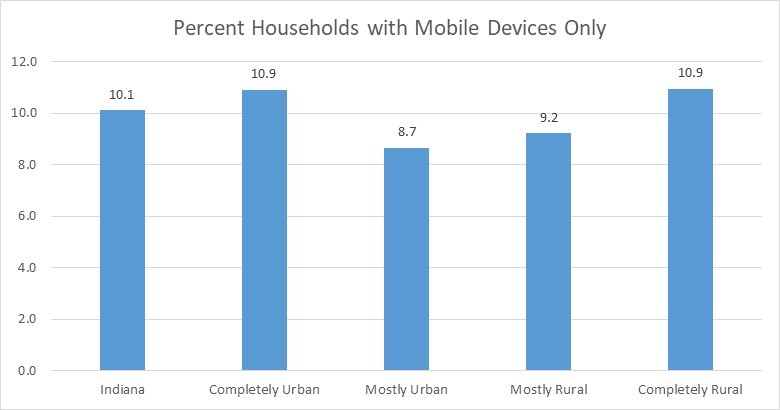
Source: 2013-2017 ACS 5-Year Estimates
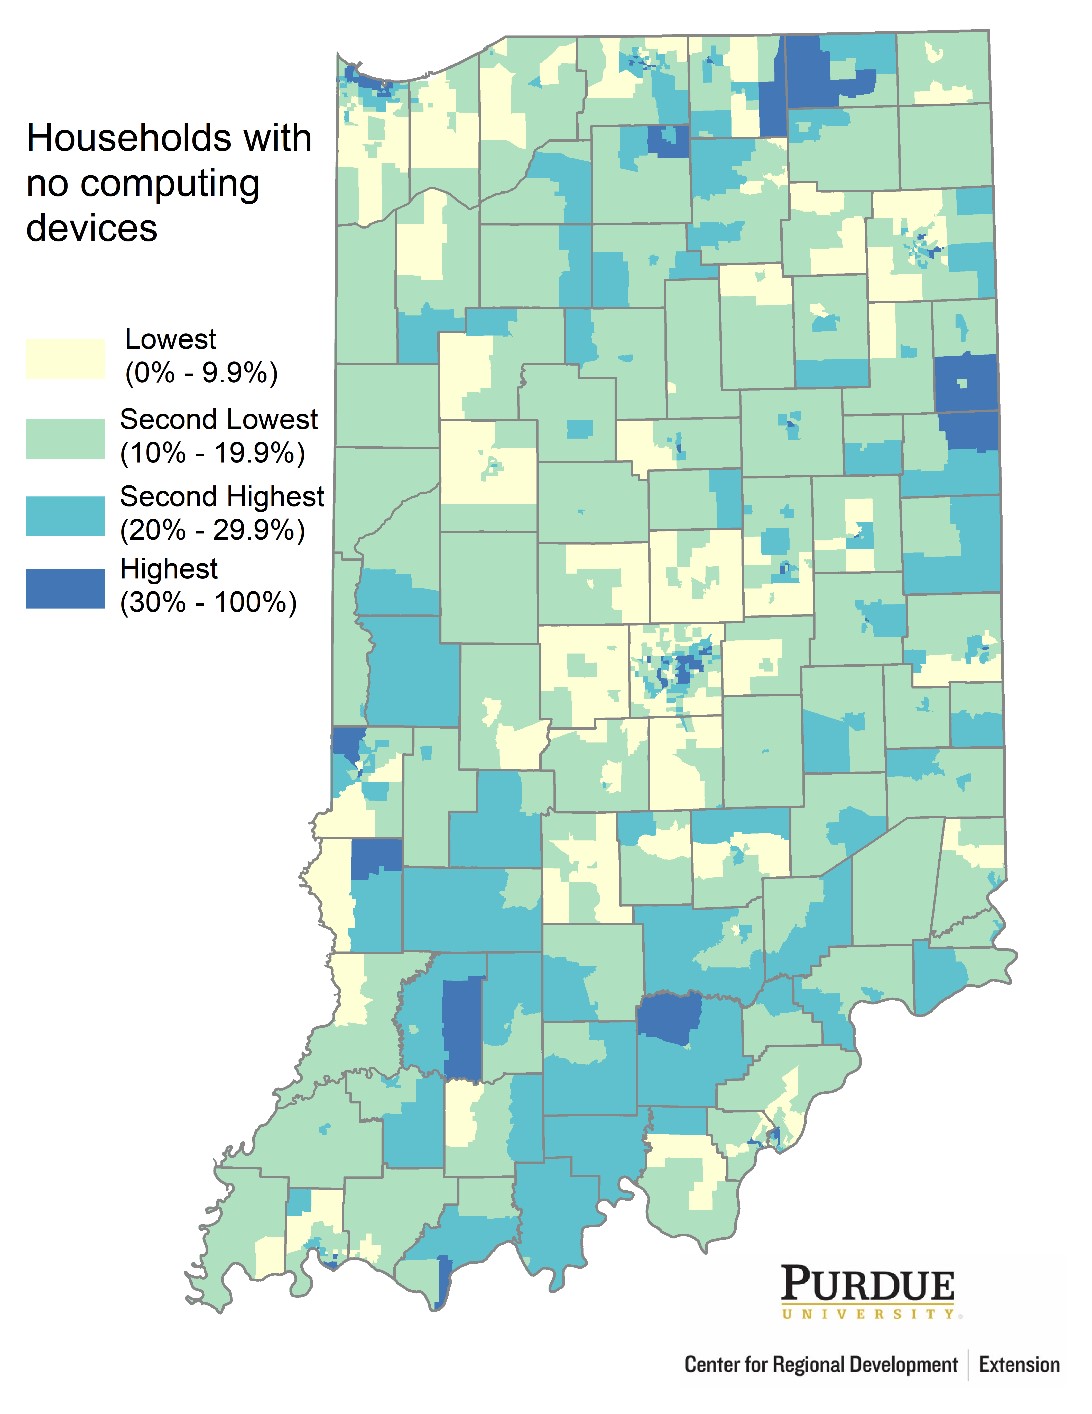
Lastly, about 14.5 percent of Hoosier households lacked computing devices of any kind. As expected, the share was higher among completely rural households. Lacking computing devices places any household at a disadvantage given that these are needed to access the internet.

Source: 2013-2017 ACS 5-Year Estimates
Moreover, the map below shows the percent of households lacking computing devices, where a darker color denotes a larger share. Note a pocket of neighborhoods in east-northeastern Indiana as well as inner-city neighborhoods in Indianapolis.
When all is said and done, about half a million households in Indiana did not have access to the internet as defined by this dataset (only excludes dial-up). Moreover, 215,000 connected to the internet only through their cellular data plan and about 386,000 lacked computing devices of any kind.
As shown here, a larger share of households is mostly rural or completely rural. Recent funding announcements by Governor Holcomb and federal agencies should help move the needle to improve internet access. Also, efforts should also be made so that Hoosier households have computing devices to fully leverage the potential of the digital age and shed light on their internet darkness.

Roberto Gallardo is the Vice President for Engagement and an Associate Professor in the Agricultural Economics Department. He holds an electronics engineering undergraduate degree, a... read more


