Remote Work Readiness in Indiana: What Covid-19 Taught Us

When the COVID-19 public health emergency hit in March of this year, most organizations and employers scrambled to continue working remotely to slow down the virus’ spread. While the economic impact has been significant, many organizations were indeed able to continue their operations remotely.
But were organizations ready for this quick transition? What were the barriers they faced?
To get a better idea of the level of remote work readiness among Indiana organizations, our Center partnered with the Indiana Office of Community and Rural Affairs (OCRA) and the Secretary of Career Connections and Talent to conduct an online survey.
Specifically, we were interested in learning more about the organizational capacity to remote work, which in addition to lack of adequate internet connectivity or specific industries and occupations not being remote work friendly, can undermine or augment this strategy. We were also interested in learning more about the remote work impact on the organization’s workers and processes.
A total of 209 valid responses were received from 71 out of the 92 counties in Indiana. The largest share of responses was from nonprofit organizations (includes libraries) with 47.5% followed by businesses and government entities (including municipal and county government) with 32.2%.
Regarding number of employees, the highest share of respondents had between 2-9 employees followed by a bit more than one-fifth (22.1%) with 50 or more employees. On the connectivity side, virtually all respondents said their organization had access to internet, with half of them reporting using fiber-optic followed by one-third using cable.
Survey was analyzed using three main categories: resources and help available, impact on workforce and roles, and organizational remote work capability. These three categories provide a good sense of how Indiana organizations fared when shifting to a remote work strategy and what opportunities and challenges lay ahead.
As shown in Figure 1, majority of respondents were able to find the resources/guides they needed when shifting to a remote work strategy. Close to a third relied on colleagues/industry association while close to one-fifth relied on internet search engines. Also, when encountering information technology issues, close to one-fifth of respondents relied on either consultants or colleague/industry associations. Overall, respondents on average relied on two sources when it came to information technology help or finding remote work resources (not shown).
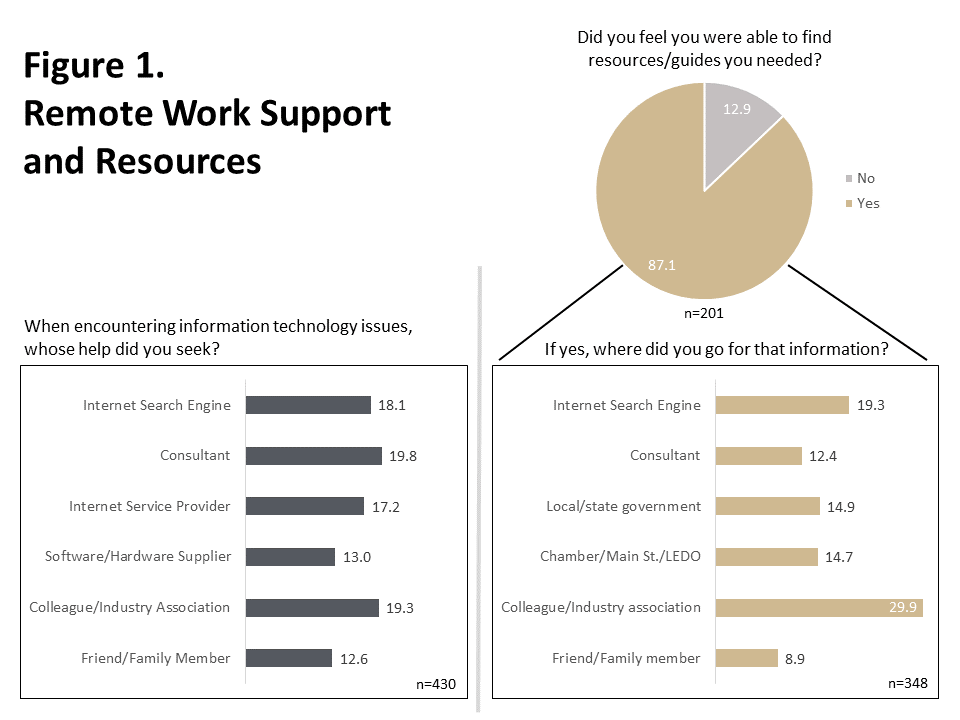
Source: PCRD Remote Work Readiness Survey
Regarding the impact a remote work strategy had on workers and/or roles, Figure 2 shows that close to three-quarters of respondents indicated that 20% or more of its roles could be accomplished remotely. Unfortunately, however, close to 10% of respondents had to lay off or furlough workers because their job functions could not be done remotely. Most of those reporting more than 20% of workers laid off or furloughed had between 2 and 9 employees and were businesses (not shown). In addition, about 9.4% of respondents automated roles that were formerly done by employees. However, more than half of those automating roles indicated it affected less than 5% of their organization’s roles.

Source: PCRD Remote Work Readiness Survey
Finally, Figure 3 shows that more than one-fifth of respondents (22.5%) are considering allowing remote work in their organizations while close to half said remote work was only temporary (46.2%). Regarding organizational capacity, the highest share of responses agreed that owner/management had a friendly remote work mindset (77.2%), followed by those that agreed that employees had adequate skills (72.9%). Next, about 69.7% of respondents agreed that their information technology infrastructure can support remote work while 68.2% agreed that their organizations can engage/benefit from remote work overall. When it came to processes and operations in the organization being conducive to remote work, 53.4% of respondents agreed versus 40.3% agreeing a remote work policy was in place. Finally, slightly more than 10% of respondents agreed with the statement that their organizations did not know how to become remote work capable.
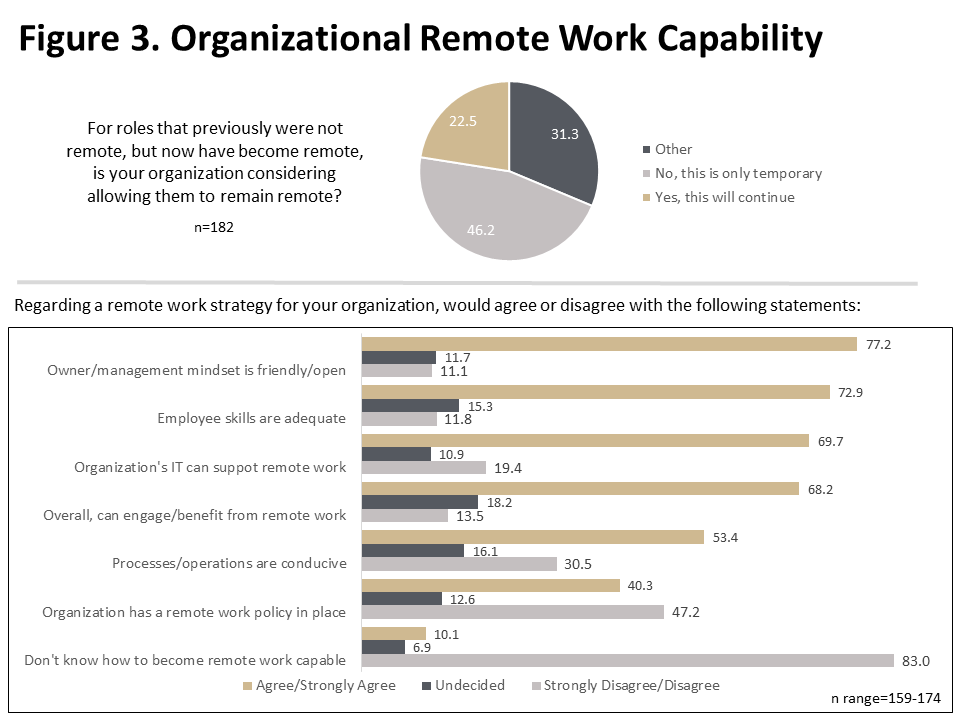
Source: PCRD Remote Work Readiness Survey
It is worth to better understand what may be keeping almost half of respondents (46.2%) from not continuing with remote work. The share of those not wanting to continue to remote work was not particularly higher for any organization type, although nonprofits had a slightly higher share overall. However, the largest chunk of those not interested in continuing remote work had between 2 and 9 employees followed by those with 50 or more.
What about organizational capacity and mindset?
Figure 4 shows the share of those that agreed or strongly agreed with specific remote work-related statements by willingness to continue to remote work. The share of those not willing to continue to remote work was lower compared to those that will continue for each statement asked.
Consider that 94.7% of those that are willing to continue to remote work agreed or strongly agreed that the mindset is friendly/open to this strategy versus 61.5% of those that are not willing to continue, a 33.2 percentage point difference. Note also that less than one-third (27%) of those not continuing with remote work agreed or strongly agreed that their organizations had a remote work policy in place versus 60% of those that are willing to continue remote work, a 33 percentage point difference. In, the end the greatest percentage point difference was on the perception that the organization can engage/benefit from remote work, an almost 40 percentage point difference (89.5% versus 50.6%).
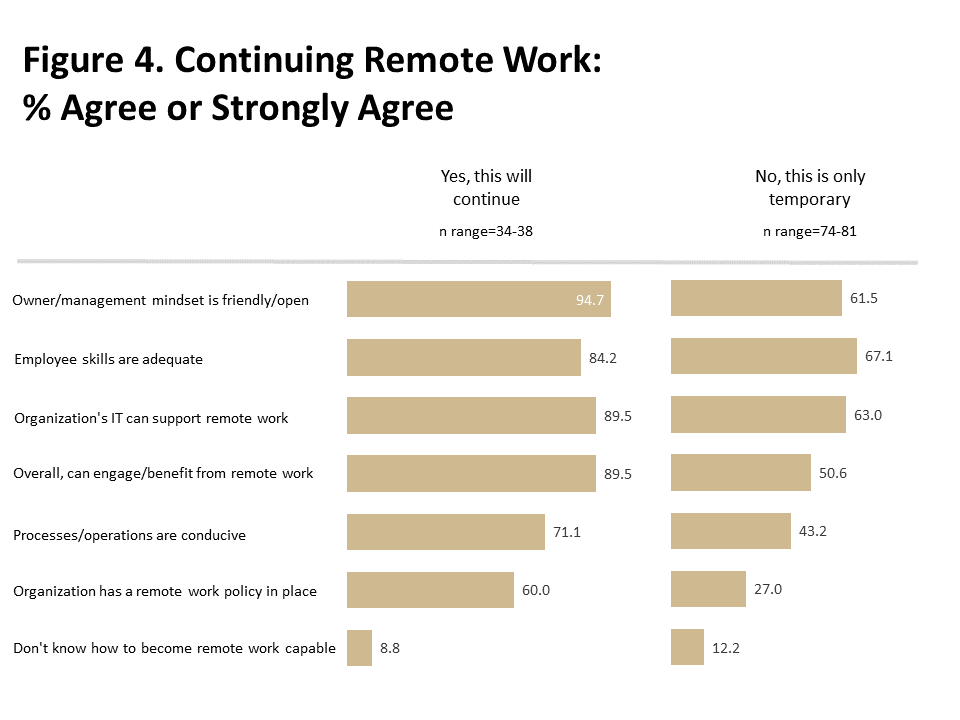
Source: PCRD Remote Work Readiness Survey
In summary, more than two-thirds of Indiana organizations that participated in the survey agreed or strongly agreed they could engage/benefit from remote work (Figure 3). Also, more than one-fifth or 22.5% is considering continuing remote work as a strategy for their organization (Figure 3). It is also clear from the survey that organizations need help drafting remote work policies and ensuring their processes/operations (single communication channel, project management, billing, marketing, etc.) are conducive to remote work. On the other hand, about 11% of those surveyed felt owner/management mindset was not remote work friendly and employees did not have adequate skills. Close to one-fifth felt their organization’s information technology infrastructure could not support remote work and almost half (46.2%) said that remote work was only temporary.
Note that when it comes to continuing to remote work, the largest difference between those that will and those that won’t (consider it a temporary strategy) was in the perception of their organizations engaging/benefitting (See Figure 4). In other words, organizations had no choice but to engage in remote work because of COVID-19 but still feel they cannot benefit or engage moving forward. Type of business and how conducive it was to remote work does not explain this since respondents were given an option to say that the remote work statements were not applicable to their organization. Therefore, the assumption can be made that the work these organizations do was remote work friendly.
Finally, among those surveyed, no more than 10% were affected by not being able to engage in remote work when the public emergency was declared resulting in laid off or furloughed employees as well as automation of roles previously done by workers (Figure 2). Those impacted were predominantly businesses with less than 10 employees.
So, what can be done? First, an increase in awareness beyond the COVID-19 shock needs to happen on the long-term benefits of this strategy. And second, targeted technical support efforts need to take place as well to ensure a mindset, adequate skills among employees, information technology infrastructure, and processes are supportive of remote work. Workforce development boards, local economic development organizations, chambers of commerce, state agencies, and Purdue extension among others can play a role in implementing these efforts.
Feel free to play with the survey data using the interactive tool below. For example, under group by select “Organization Type” and under compare select “IT advice from: Search Engine”. You will see that the majority of those relying on search engines when encountering IT issues were nonprofits followed by businesses. To reset the graph, select the blank option at the top of the drop-down menu.

Roberto Gallardo is the Vice President for Engagement and an Associate Professor in the Agricultural Economics Department. He holds an electronics engineering undergraduate degree, a... read more


