Who is Remote Working in the U.S.?

Remote work or telework or telecommute was first coined in the 1970s and has ebbed and flowed since then in economic development conversations.
Today, due to a higher broadband penetration, ongoing sophistication of digital applications, and the digitalization of the workforce and the economy, and the Coronavirus emergency, remote work is once more surfacing as a feasible economic development alternative for urban and rural communities alike.
While research on the impact of work from home is ongoing, studies have found an increase in productivity, performance, engagement, retention, and profitability. Another study also found a positive impact of telework in median household income at the neighborhood level.
More importantly, the potential of true remote work efforts is not only confined to economic development but also to environmental sustainability, diversity and inclusion, and work-life satisfaction.
So, how many U.S. workers actually work from home? Are there specific occupations, industries, or class of workers that are more telework friendly than others?
To answer these questions we turn to the American Community Survey. When asking about primary means of transportation to work, work from home is an option. Keep in mind that these estimates include respondents that work much of the week from home and excludes those who work at home during off hours.
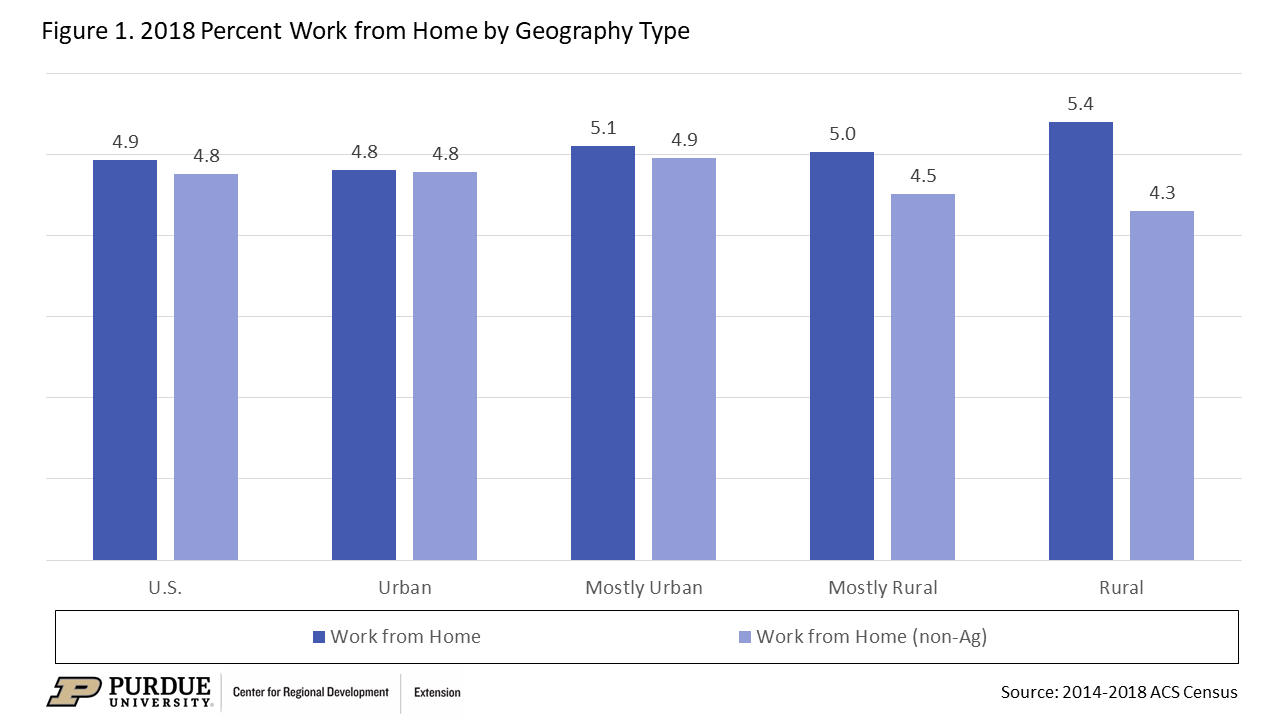
Figure 1 below shows that the percent of workers ages 16 and over in the U.S. that worked from home was 4.9%. This amounted to 7.4 million workers. In addition, we grouped Census tracts into four groups depending on the share of their population living in urban areas: urban (99% or more living in urban areas), mostly urban (between 50% and 99% living in urban areas), mostly rural (between 1% and 49.9% living in urban areas), and rural (less than 1% living in urban areas).
Figure 1 shows that rural areas had a higher share of workers working from home compared to urban (5.4 versus 4.8%). However, once agriculture industry workers are removed from these estimates, the rural share drops from 5.4 to 4.3%, slightly below the urban share of 4.8%, which not surprisingly remained unchanged.
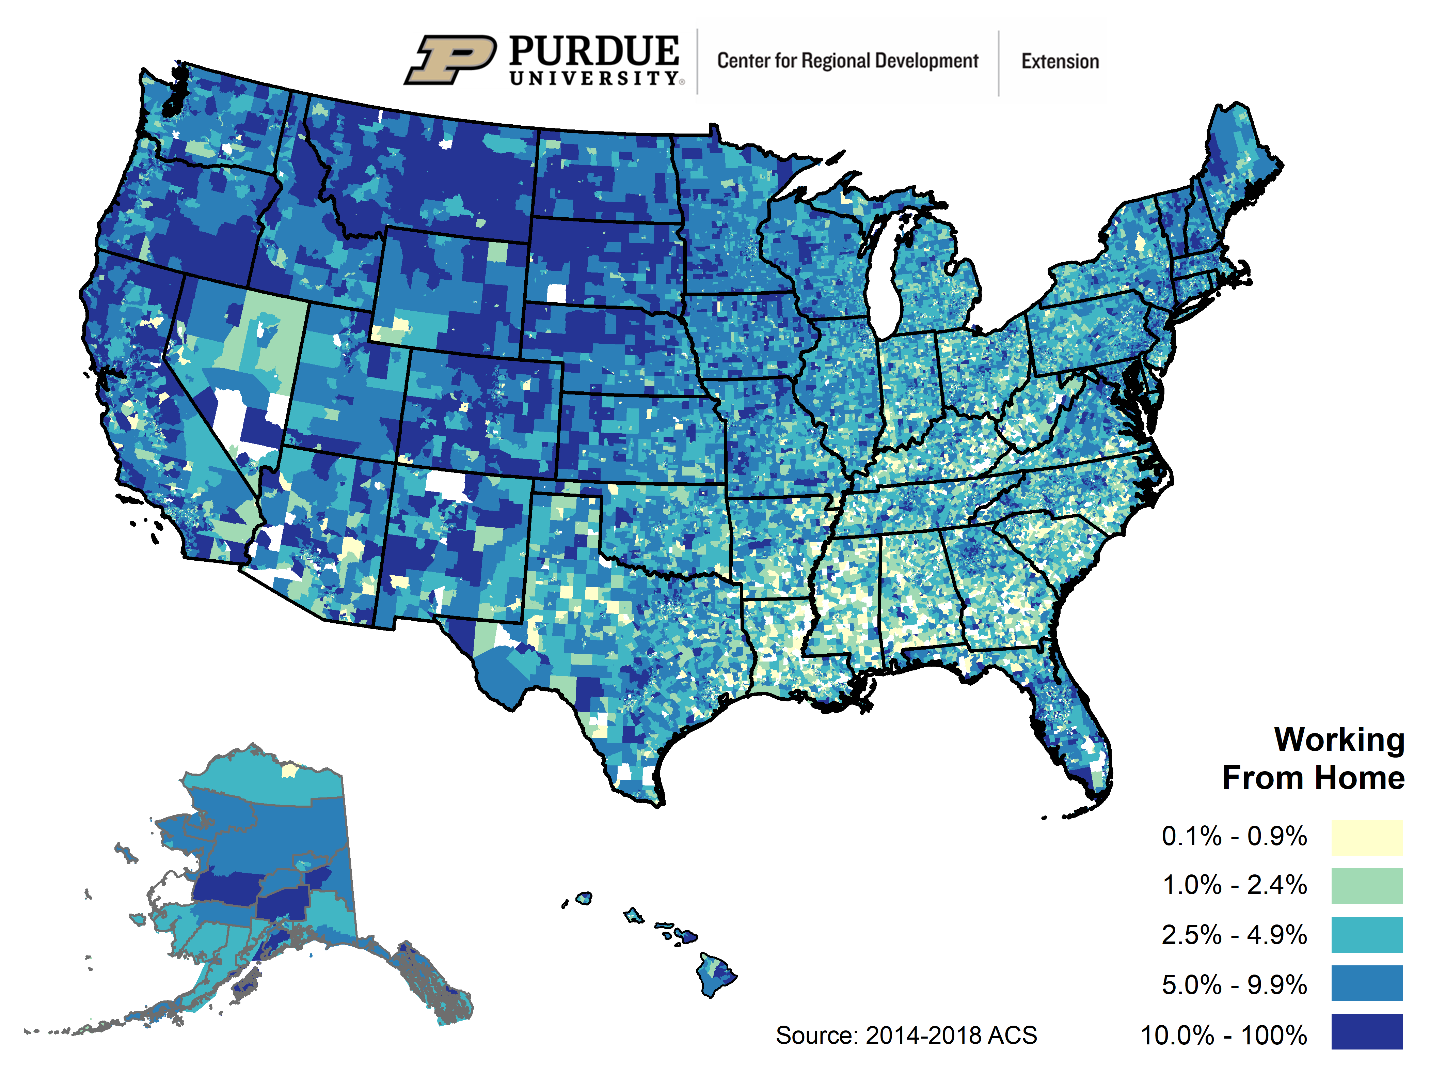
Maps below show U.S. census tracts grouped in four equal groups (same number of tracts per group) by percent of work from home and percent of work from home non-agriculture. Notice, when including farmers, the great plains have a darker blue (highest share of work from home group) while the southeast has a lighter color.
When farmers are removed, they color dynamics change somewhat. The great plains are no longer dark but rather the coasts and pockets in northern Idaho and northwestern Montana, to name a few.

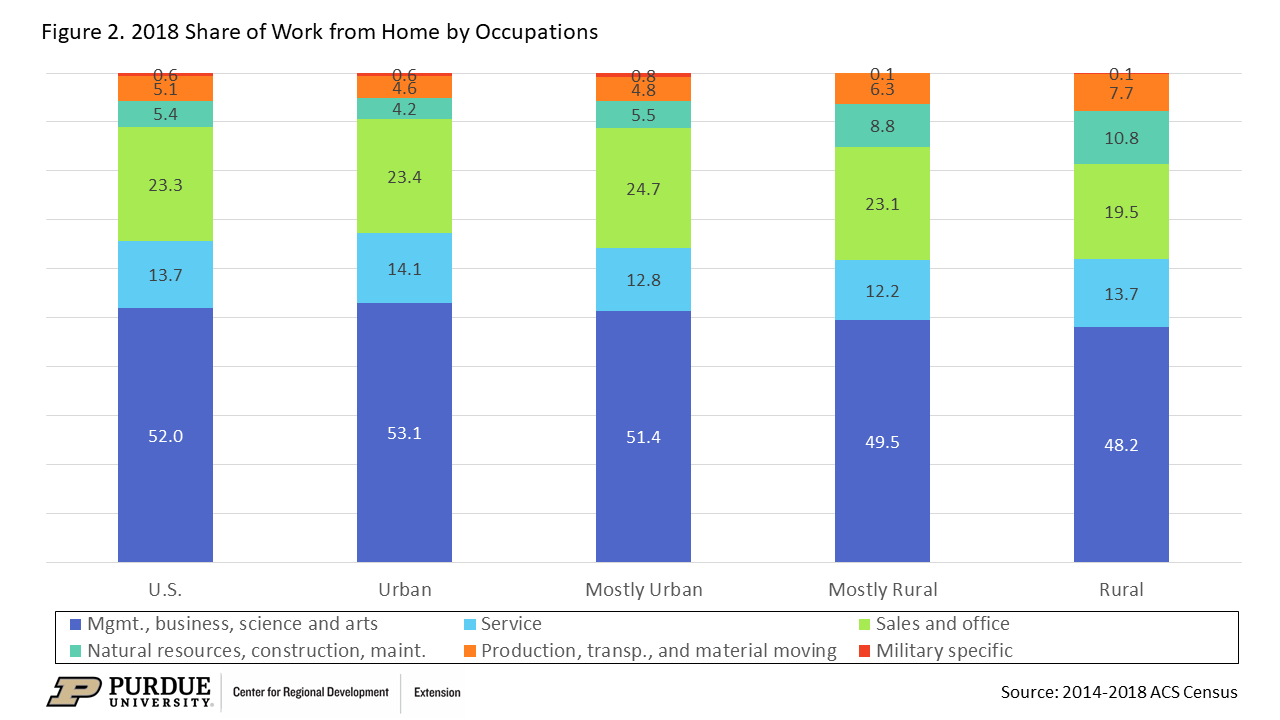
More than half of those working from home had management, business, science and arts occupations as shown in Figure 2. Close to one-quarter had sales and office occupations while production, transportation, and material moving and military occupations had the lowest share of remote workers. As expected, rural areas had a higher share of teleworkers in natural resources, construction, and maintenance compared to urban areas (10.8 versus 4.2%).
In regards to industries, Figure 3 shows that services have the highest share of remote workers followed by wholesale, retail, transportation, warehousing and utilities. However, again, rural areas have a lower share of teleworkers in services compared to urban but a higher share of those in agriculture, forestry, fishing, hunting and mining (20.4 versus 0.6%).

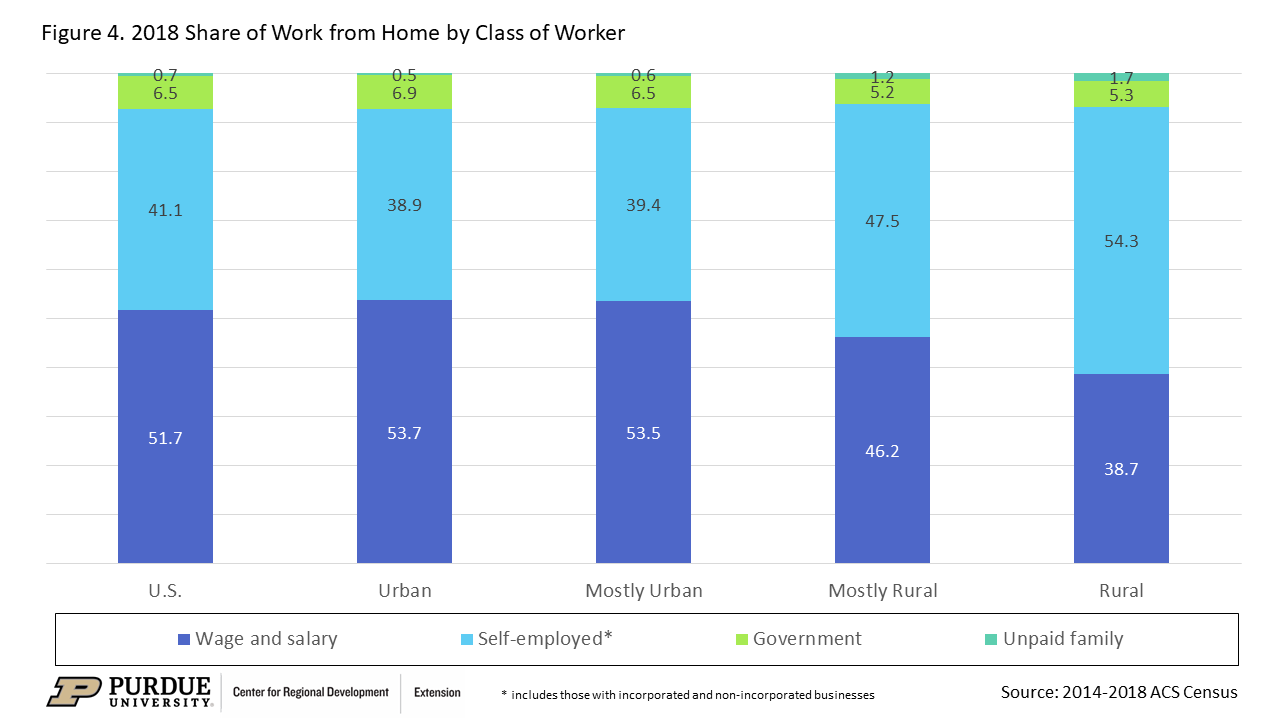
Lastly, Figure 4 shows the share of those working from home by class of workers. More than half in the U.S. were wage & salary workers while about 40% were self-employed. This again varies when looking at rural areas: less than 40% of those working from home in rural areas were wage & salary workers while more than half were self-employed. Keep in mind this includes farmers.
It is clear from this data that not all occupations, industries, and class of workers are remote work friendly. This needs to be kept in mind, especially during the current public health emergency. Areas with a higher share of workers in industries, occupations, and/or class of workers that are not remote worker friendly will have to come up with other strategies during this crisis.
From an economic development perspective, remote work friendly industries, occupations or class of workers should be supported as an alternative economic development strategy, especially in areas that may not have a competitive advantage when it comes to traditional industrial attraction. Remote work friendly policies should be enacted and ensure both businesses and employees are aware of this strategy and address any needs they may have as they seek to pursue this strategy.

Roberto Gallardo is the Vice President for Engagement and an Associate Professor in the Agricultural Economics Department. He holds an electronics engineering undergraduate degree, a... read more


