Job Earnings Index – A New Metric by PCRD

The Purdue Center for Regional Development has created an index to monitor earnings across an array of jobs throughout Indiana. The Job Earnings Index (JEI) will be used to see how earnings for different occupations have changed since 2005. JEI will look into high-earnings jobs (HEJ) and low-earnings jobs (LEJ). The computation of HEJ and LEJ looks at the median hourly earnings of over 700 unique occupations in a particular year, for each year in the series. Once this number is identified, HEJ is marked as those above this wage while LEJ is marked as those below this wage. Once marked HEJ and LEJ jobs are summed and then the total is divided to create an index of HEJ and LEJ.
Figure 1. Indiana (Statewide) Job Earnings Index
The Purdue Center for Regional Development has created an index to monitor earnings across an array of jobs throughout Indiana. The Job Earnings Index (JEI) will be used to see how earnings for different occupations have changed since 2005. JEI will look into high-earnings jobs (HEJ) and low-earnings jobs (LEJ). The computation of HEJ and LEJ looks at the median hourly earnings of over 700 unique occupations in a particular year, for each year in the series. Once this number is identified, HEJ is marked as those above this wage while LEJ is marked as those below this wage. Once marked HEJ and LEJ jobs are summed and then the total is divided to create an index of HEJ and LEJ.
Further analysis of the JEI shows the higher number of jobs in the HEJ sector tend to be truck drivers and registered nurses. The data continues to show the higher number of jobs in the LEJ sector are: laborers, retail salespersons, fast food workers, assemblers, fabricators, and office clerks. Real estate sales agents provide the highest number of jobs that shift between HEJ and LEJ during the 16-year timespan.
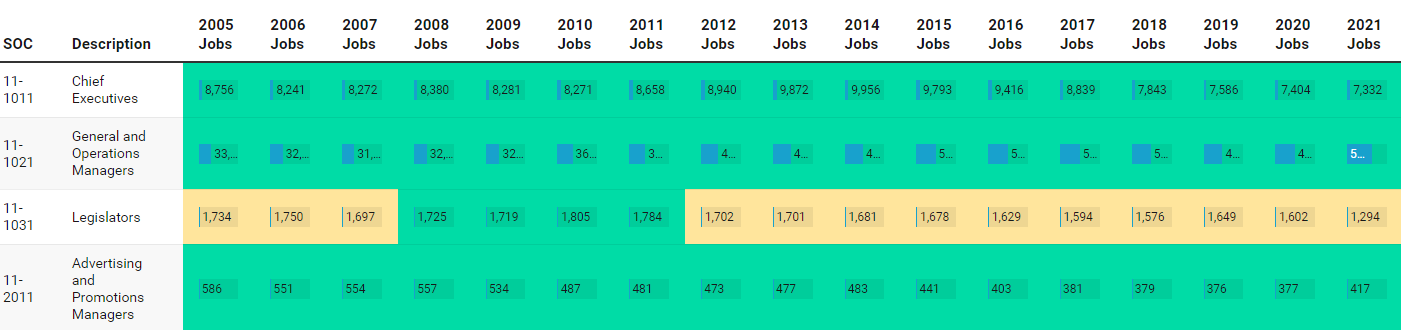
Job Earnings Index – Occupation Tables
The JEI also breaks down between metro and nonmetro counties.
Metro Counties
- Allen
- Bartholomew
- Benton
- Boone
- Brown
- Carroll
- Clark
- Clay
- Dearborn
- Delaware
- Elkhart
- Floyd
- Hamilton
- Hancock
- Harrison
- Hendricks
- Howard
- Jasper
- Johnson
- Lake
- La Porte
- Madison
- Marion
- Monroe
- Morgan
- Newton
- Ohio
- Owen
- Porter
- Posey
- Putnam
- St. Joseph
- Scott
- Shelby
- Sullivan
- Tippecanoe
- Union
- Vanderburgh
- Vermillion
- Vigo
- Warrick
- Washington
- Wells
- Whitley
Nonmetro Counties
- Adams
- Blackford
- Cass
- Clinton
- Crawford
- Daviess
- Decatur
- DeKalb
- Dubois
- Fayette
- Fountain
- Franklin
- Fulton
- Gibson
- Grant
- Green
- Henry
- Huntington
- Jackson
- Jay
- Jefferson
- Jennings
- Knox
- Kosciusko
- Lagrange
- Lawrence
- Marshall
- Martin
- Miami
- Montgomery
- Noble
- Orange
- Parke
- Perry
- Pike
- Pulaski
- Randolph
- Ripley
- Rush
- Spencer
- Starke
- Steuben
- Switzerland
- Tipton
- Wabash
- Warren
- Wayne
- White
Figure 3. Indiana (Metro) Job Earnings Index
The average JEI for metro Indiana is 0.63. However, this index has some wide-ranging swings as well as flat areas. During the 2009 recession, the index flattens and stays near 0.6 for four years. Then the index climbs to a high of 0.68. The metro JEI finally dips a bit before resting at 0.66 in 2021.
Figure 4. Indiana (NonMetro) Job Earnings Index
Nonmetro Indiana JEI remains lower across the timespan compared to both metro and statewide Indiana. Nonmetro JEI follows a similar path as statewide Indiana. It starts in 2005 at its lowest point of 0.47. Then it climbs and like others, gets hit by the 2009 recession and drops. After the recession years in 2013 it climbs again to its highest peak in 2020 of 0.57. Nonmetro JEI was hit hard with the pandemic and one of its worst year-over-year declines from 2020 to 2021, where it currently lies at 0.54.
One takeaway from this index shows just how many HEJ and LEJ are there in total. Looking at the year 2021, statewide Indiana has a total of 3,883,953 jobs, with 61% of them in the LEJ sector. Metro Indiana has 3,070,341 and 60% in the LEJ sector. And nonmetro accounts for 730,278 with 65% in the LEJ sector.
The JEI reveals a metro advantage in that for every 100 low earnings jobs there are 66 high earning jobs compared to 54 high earning jobs in nonmetro areas in 2021. It is also revealed that metro JEI drives the state of Indiana JEI as both are close at 0.66 and 0.65, respectively. Programs such as remote worker and talent attraction in rural counties can improve the nonmetro JEI by attracting people followed by jobs.
Finally, the JEI looks strictly at the median earnings of jobs and the total number of jobs. The JEI does not factor in the quality of life with these jobs nor either the safety and security of the jobs within this index.

Benjamin St. Germain is a GIS Analyst for the Purdue Center for Regional Development, joining the staff in 2015. Benjamin uses a variety of data... read more


