Introducing the New IRS Migration Tool
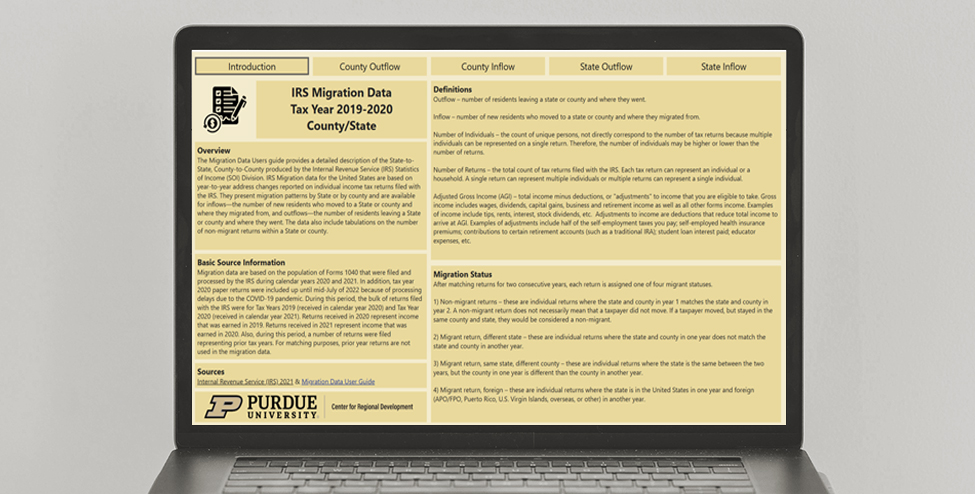
The Purdue Center for Regional Development (PCRD) has developed an online tool to present migration data across U.S. County and state level geographies. Migration data is provided by the Internal Revenue Service (IRS) statistics of income (SOI) division. Data is derived from tax form 1040 filed and processed by individuals and households in calendar years 2020-2021. It will be beneficial to understand some of the terms and definition of the tool before beginning to use it. Below is a list of a few selected terms, and full definitions are provided on the introduction page of the tool.
- Outflow
Number of residents who leave a state or county and where they migrate to. - Inflow
Number of new residents who move to a state or county and where they migrate from. - Number of Individuals
The count of unique persons. - Number of Returns
The total count of tax returns filed with the IRS. - Adjusted Gross Income (AGI)
Total income minus deductions, or “adjustments” to income that you are eligible to take. - Non-migrant return
These are individual returns where the state and county in one year match the state and county in the next year. - Migrant return, different state
These are individual returns where the state and county in one year does not match the state and county in another year. - Migrant return, same state, different county
These are individual returns where the state is the same between the two years, but the county in one year is different than the county in another year. - Migrant return, foreign
These are individual returns where the state is in the United States in one year and foreign in another year.
The migration tool is set up in five different pages: Introduction, County Outflow, County Inflow, State Outflow, and State Inflow. Introduction is the default landing page where the overview, explanation, definitions, and data sources are available.
County Outflow allows the user to select any county within the United States. In county outflow, the county the user selects are known as origin from Year 1, i.e., tax year 2019. After making a selection, the charts and table will adjust and display the values of county destination from Year 2, i.e., tax year 2020. County Outflow will show the number of individuals, returns, AGI of residents leaving a county and where they went.
County Inflow shows the residents who moved into a county and where they migrated from. Start by selecting a county from tax year 2019 and the charts and table will update to display the values of tax year 2020.
State Outflow and State Inflow operate very similarly but on the state level versus the county level. In addition, State Outflow and State Inflow provide maps that allow users to spatially visualize outflow, inflow, and migration.
The most common migration status is non-migrants, where individuals remain within the county/state for both origin and destination for tax year 2019 and tax year 2020. Total migration-same state, total migration-U.S. and foreign, and total migration-U.S. are also available for different states. Traditionally, neighboring counties and states have the highest shares of individuals, or returns, but outliers do exist. For instance, the table below shows the top 5 states of Indiana’s Outflow and Inflow. Of the Hoosiers that have migrated out of state, most have moved to Florida. Neighboring states received the next number of individuals from Indiana. Of individuals moving into Indiana, most come from Illinois. Other neighboring states receive the rest of the lion shares, but Floridian residence have also made their way into the top 3 of Indiana’s Inflow.
| Indiana Outflow | Indiana Inflow | ||
|---|---|---|---|
| State | # of Individuals | State | # of Individuals |
| Florida | 15,271 | Illinois | 25,684 |
| Illinois | 14,130 | Kentucky | 10,671 |
| Kentucky | 8,883 | Florida | 10,540 |
| Michigan | 8,476 | Ohio | 9,381 |
| Ohio | 8,154 | Michigan | 7,915 |
The Purdue Center for Regional Development continues to provide data resources in a range of other topics. For other data analysis needs please visit PCRD’s tools and visualization page. Lastly, feel free to directly reach out to PCRD with any inquires at pcrd-web@purdue.edu or 765-494-7273. Thank you.

Benjamin St. Germain is a GIS Analyst for the Purdue Center for Regional Development, joining the staff in 2015. Benjamin uses a variety of data... read more


