The Evolution of Rural Indiana Stats (2025)
The Purdue Center for Regional Development (PCRD) continues to update its online data platform, Rural Indiana Stats (RIS). Nearly all 130+ variables that are available on the RIS site have been updated with the newest data available. The major data products within RIS include county geographic typologies, housing characteristics, local government fiscal information, socioeconomic characteristics, agriculture & forestry, and digital inclusion. The partnership between PCRD and the Indiana Office of Community and Rural Affairs (OCRA) was instrumental in launching the site over six years ago and continues, to this day.
RIS represents a valuable tool for any Hoosier looking to find specific data on any of the state’s 92 counties. It is designed to provide individuals, leaders, organizations, and agencies with ready access to a core set of data for informing and guiding local programs, projects and investment activities. Data from RIS in the past has been used to support the development of local and regional comprehensive economic development strategies (CEDS), to shape place-based workforce attraction plans, guide the effort of local economic development organizations, and validate problems/issues being addressed in a variety of grant applications. As for specific examples, the Indiana Housing and Community Development Authority is utilizing the RIS data on housing to help determine which grant applications submitted to the state agency should be funded. Select members of the Indiana Association of Regional Councils are tapping the digital inclusion data to inform local, state, and national officials of the broadband-related needs of their regions. Furthermore, the Office of Community and Rural Affairs is using geographic typologies to ensure that resources designed to help rural Indiana communities are being targeted to the right places.
In early 2025, Rural Indiana Stats has undergone some major changes, specifically in the presentation of data as well as a few new variables. Rural Indiana Stats has always had the ability to present data via mapping platforms, and this will continue to be the same. In addition, a new way to visualize the data will be available. New Tableau-based dashboards are now available and have replaced the tabular data. The image below showcases how the new dashboards will look. This example uses demography under the socio-economic section. At the top of the dashboards, the variable types will be presented. Here, under demography, users will find five different variable types: Population, Poverty, Household and Family Structure, Educational Attainment, and Race and Ethnicity. Population is currently selected and displayed, and all 92 counties (i.e., the whole of Indiana) are selected by default. The three population variables are displayed: Total Population, Population by Sex, and Population by Age. By default, all 92 counties will be selected, and the user can see the total population of 6,811,752; the male population of 3,377,011; and the female population of 3,434,741; and the make-up of population by different age groups.
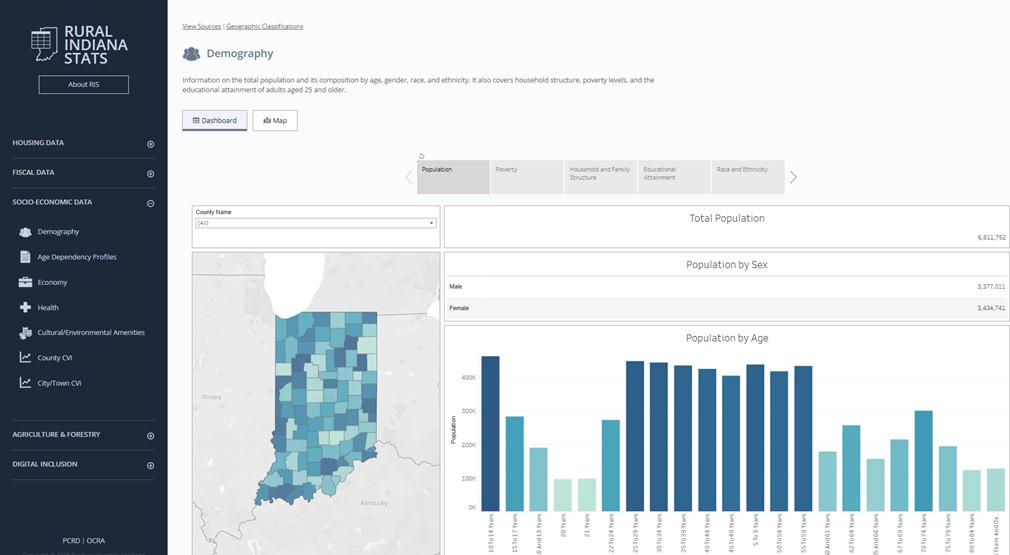
Rural Indiana Stats - Demography
Another new addition recently added to Rural Indiana Stats is Age Dependency Profiles. The age-dependency ratio (which is the number of children under 15 and seniors over 65 per 100 workers ages 16 to 64) provides information to economic and regional developers to better understand this issue. In this example of Adams County, the age dependency ratio is 75. A higher age-dependency ratio may translate into lower economic growth because it affects saving rates, investment rates, housing markets, consumption patterns, and the quality of life of workers who need to care for both children and senior parents. This full breakdown of age dependency can be sliced up with other variables. The split between child and senior dependency for over 23 years is located on the top right chart. The left side chart displays the breakdown among rurality by urban, suburban, and rural for child and senior dependency. The bottom right chart displays the age dependency trend for the selected county, Indiana, and all of the United States.
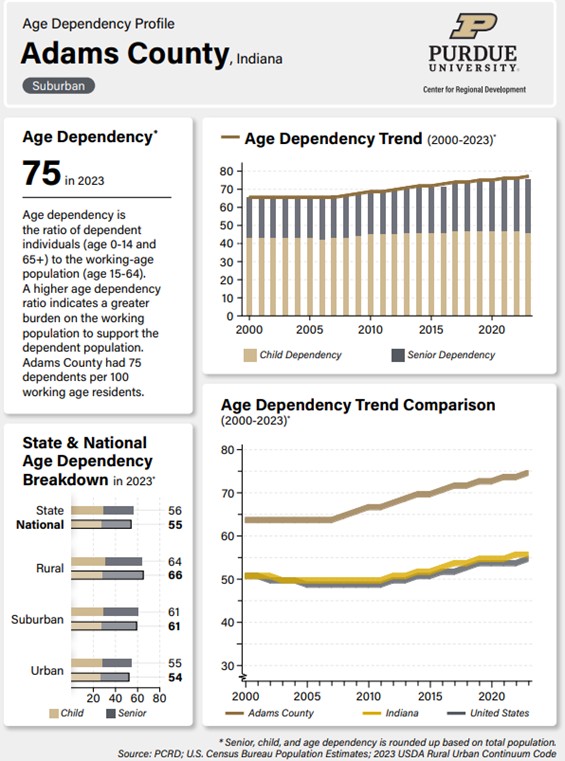
Rural Indiana Stats - Age Dependency Profiles
Lastly, Indiana’s Distressed Counties map can be viewed within the geographic classification. This map has undergone extensive changes since it was first deployed a few years back. The Distressed Counties map pulls data from trusted sources like the Bureau of Economic Analysis (BEA), Bureau of Labor Statistics (BLS), and the American Community Survey (ACS). The user can dive into the details of all 92 Hoosier counties, divided into distressed or non-distressed categories. Going a step further, the user can break down distressed counties based on factors like unemployment, per capita personal income (PCPI), and per capita income (PCI). Counties earn the distressed label if they fall below specific thresholds, such as an unemployment rate at least 1% higher than the national average and PCI and PCPI at 80% or less than the national average. This map receives monthly updates as the BLS provides continuously new seasonally adjusted unemployment data for all 92 counties. This affects the distressed criteria and counties will fluctuate among the eight categories they are placed in:
- Not Distressed
- Distressed by Unemployment
- Distressed by PCPI
- Distressed by PCI
- Distressed by Unemployment + PCPI
- Distressed by Unemployment + PCI
- Distressed by PCPI + PCI
- Distressed by All
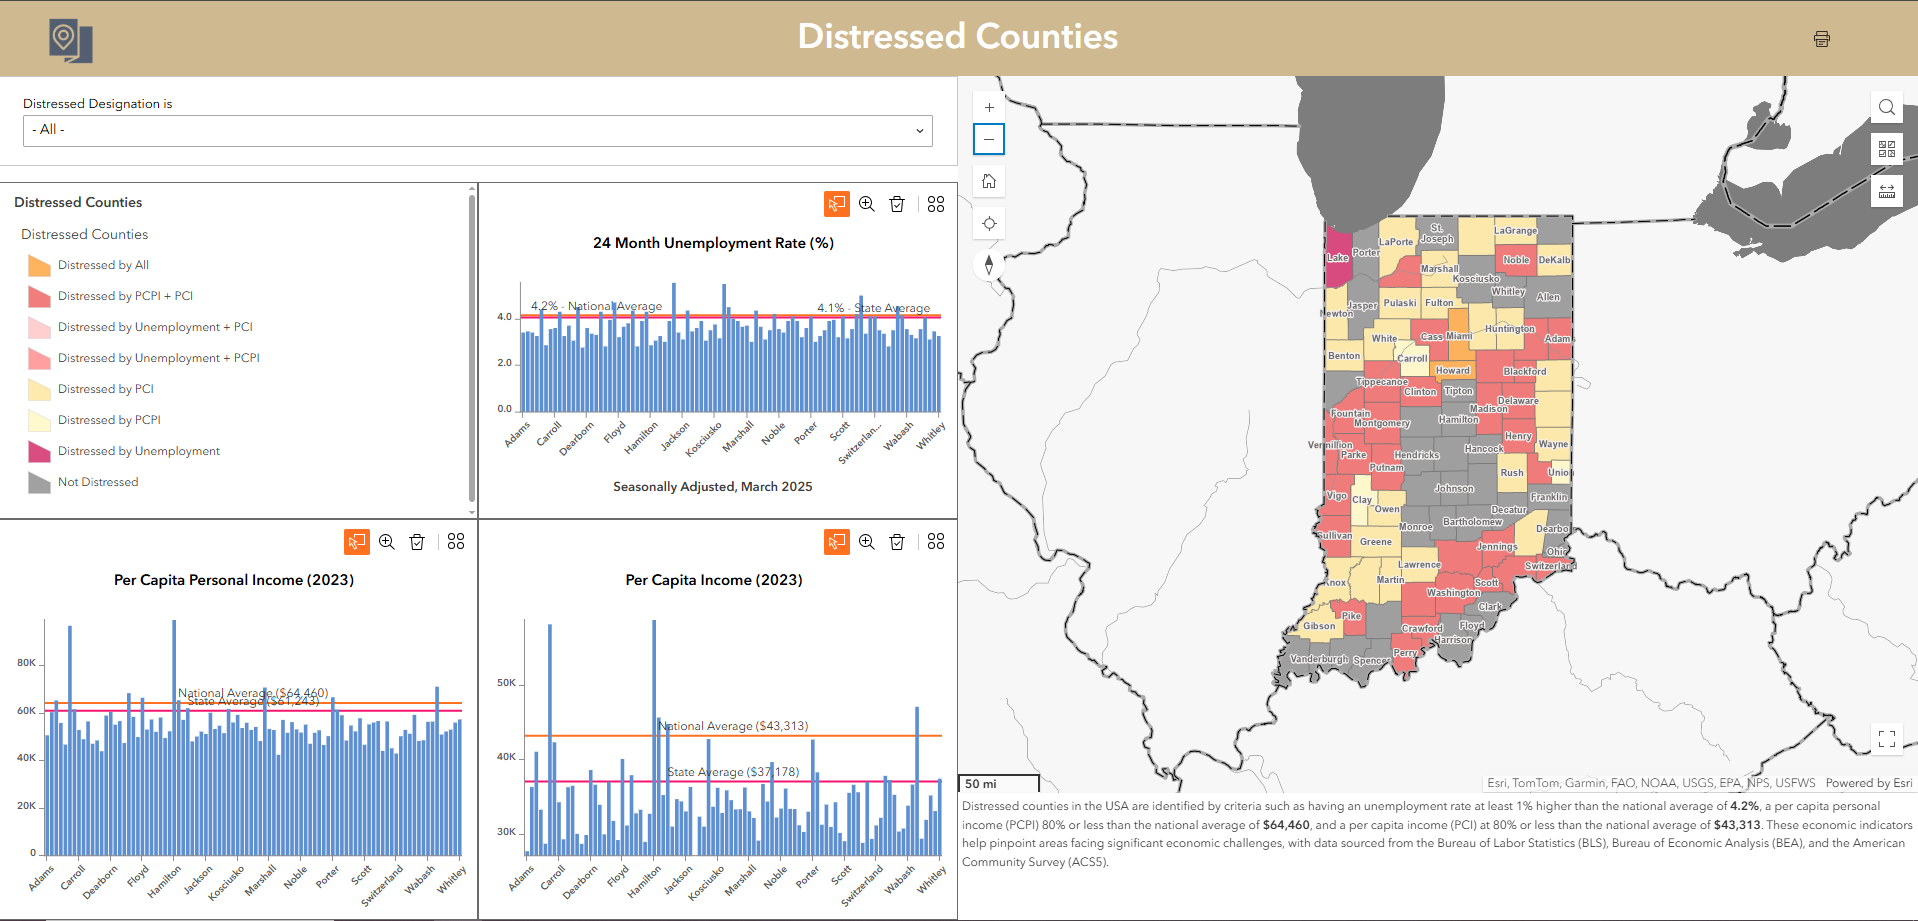
Rural Indiana Stats - Distressed Counties
Since RIS’s inception in the spring of 2017, the active number of people accessing the website continues to climb to more than 100,000 users and tens of thousands of page views. As PCRD strives to continue to make key data available to support the well-being of people, communities, and regions in the state, we welcome feedback from users as to the type of secondary data you have found most useful and what data variables you recommend being added to the RIS site in the future.
To find all the data visit Rural Indiana Stats today!

Benjamin St. Germain is a GIS Analyst for the Purdue Center for Regional Development, joining the staff in 2015. Benjamin uses a variety of data... read more