Analyzing Indiana’s Digital Landscape: Bridging Gaps and Unveiling Trends in Internet Access and Device Usage

Last month, the United States Census Bureau released the five-year 2018-2022 American Community Survey, also known as the ACS. This survey captures a variety of information on U.S. residents and households, including variables related to the digital divide.
Fortunately, we can now compare data points between the 2013-2017 ACS and the 2018-2022 ACS. In other words, we can now see if any increase or decrease took place between 2017 and 2022. For this blog post, we will look at specific internet-related variables for the country and the state of Indiana, including its urban, suburban, and rural components, to better understand the digital divide landscape.
Before we crunch numbers, here is some data housekeeping. Urban, suburban, and rural components of the U.S. and Indiana were obtained from the 2010/2020 Decennial Census Blocks. Both the 2010 and 2020 dataset categorize Census blocks as rural or urban. These numbers were then aggregated to Census tracts or neighborhoods by calculating the percentage of their population living in these rural blocks. Then, based on this percentage, each Census tract was grouped into urban (less than 25% of their population lived in rural blocks), suburban (between 25% and 75% of their population lived in rural blocks), and rural (more than 75% of their population lived in rural blocks). See Figure 1 for a map of Census tracts by urban, suburban, and rural categories.
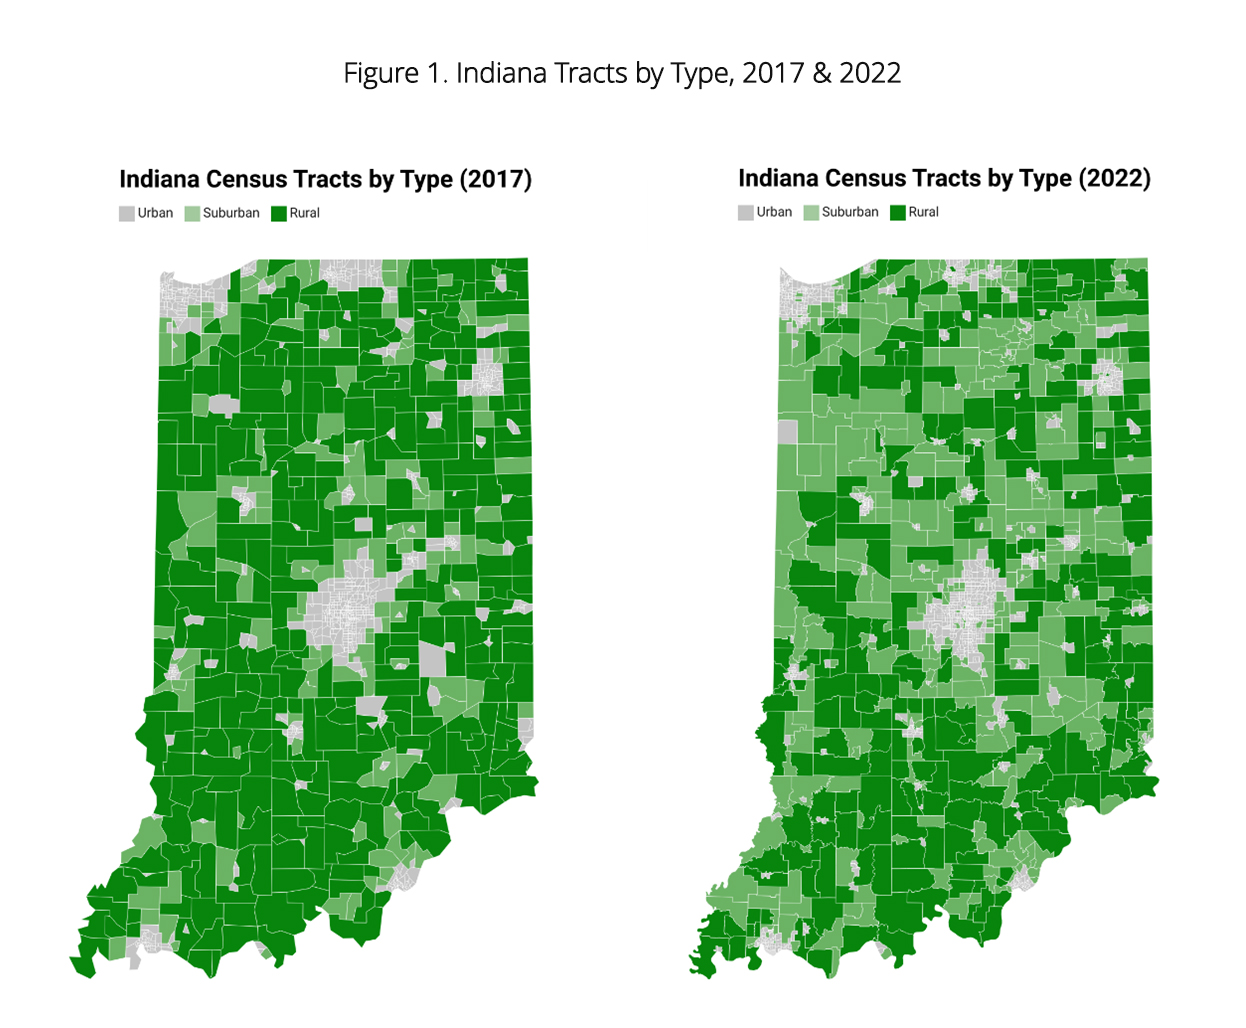
In Indiana, the urban share (gray on the map) decreased from 67.3% in 2017 to 59.3% in 2022 as did the rural share (dark green) from roughly one-fifth (20.6%) to 15.1%. The suburban share (light green) more than doubled from 12.1% to a little more than one-quarter (25.7%).
Next, we look at several variables related to household internet and devices to get a better understanding of this digital landscape in the nation and Indiana.
First is the share of households with no internet. Keep in mind the data does not say why the home does not have internet access. As shown below, this share decreased both in the United States and Indiana as well as urban, suburban, and rural areas. The percentage of households with no internet access in the state was almost cut in half between 2017 and 2022 from 20.2% to 10.6%. And while the state lags the nation, the gap is closing. The rural portions of the nation and the state had the highest share of percent of households with no internet access. Orange County saw the largest decrease—18.7 percentage points—between 2017 and 2022 while LaGrange County had the highest percentage in 2022 with 33.4% (though, there is a significant population of Amish in this county). See the interactive tables at the bottom.

Now, we look at the percentage of households relying solely on cellular data to access the internet. Access to the internet through cellular data is less than ideal because of limited data plans. In other words, households that rely solely on cellular data may not be able to fully benefit from the technology. Table 2 shows that this percentage increased in the United States and Indiana between 2017 and 2022 as well as each Census tract type.

Third, we look at the percentage of households relying solely on mobile devices (including tablets). This means they do not own a laptop or desktop computer. Mobile only users struggle to fill out job applications or complete other tasks online. Research has found they benefit less from the technology due more than likely to smaller screens. This share increased between 2017 and 2022 in both the nation and Indiana as well as urban, suburban, and rural areas.

Lastly, we look at the percentage of households with no computing devices, not even smartphones. Not having computing devices significantly limits the ability of households to benefit from internet services and applications, including remote work and/or searching or applying for jobs. As shown below, the share of households with no computing devices has declined in the nation and Indiana, as well as in urban, suburban, and rural areas.

In summary, the digital divide landscape in Indiana is a nuanced one. On the one hand, home internet access is improving—although it may mostly be due to folks accessing the internet at home through their cellular data—while homes without a computing device are declining. This is good news! Also, the gap between the nation and Indiana is closing, which is also good news.
On the other hand, the share of homes relying on cellular data only and having only mobile devices is increasing. While this is not ideal—cellular data connections have lower data limits and mobile devices have smaller screens in general—it nonetheless is a step in the right direction when addressing the digital divide in Indiana.

Roberto Gallardo is the Vice President for Engagement and an Associate Professor in the Agricultural Economics Department. He holds an electronics engineering undergraduate degree, a... read more


