Digital Distress in Indiana

(This article was adapted from the author’s Medium post)
The recent announcement of funding for the Next Level rural broadband investments in Indiana is a step in the right direction to ensure all Indiana communities participate fully in the digital age. However, broadband infrastructure is only part of the equation when it comes to digital exclusion, the number one threat to community economic development in the 21st century.
Digital inclusion refers to “the adoption of broadband technologies and its meaningful use for social and economic benefits”. So, in addition to broadband infrastructure, it is worth looking at types of electronic devices owned and internet subscriptions that can augment or undermine the meaningful use of broadband for social and economic benefits.
The U.S. Census 2013-2017 American Community Survey recently published neighborhood (Census tracts) level variables that can help us quantify areas in digital distress or that have a harder time using and leveraging the internet to improve their quality of life. These variables include:
- Percent of homes with a cellular data only internet subscription
- Percent of homes with no internet access (not subscribing)
- Percent of homes relying on mobile devices only
- Percent of homes not owning a computing device
Homes relying solely on cellular data or not subscribing to the internet are not benefiting from digital applications due to limited data plans and restricting access to outside the home. On the other hand, homes relying on mobile devices only or not owning computing devices make it harder to leverage digital applications due to smaller screens or no screens at all placing the home in digital distress.
Given that the subscription and computing device variables are not mutually exclusive, simply adding all four variables to obtain a percentage was not possible. For this reason, variables 1 & 2 (see list above) were compiled into one percentage called subscriptions (which are mutually exclusive) while variables 3 & 4 were compiled into one percentage called devices (which are mutually exclusive).
Z-scores were then calculated for both aggregated percentages (subscriptions and devices), added together, and normalized to a score from 0 to 100, where a higher number denotes a higher digital distress. Neighborhoods were considered in digital distress if their score was greater than 50. In other words, neighborhoods in digital distress had a higher percentage of homes not accessing the internet or relying only on cellular data as well as not owning a computing device or relying on mobile devices only.
A little more than 1,500 neighborhoods in Indiana were analyzed, of which 214 or 14.2 percent were in digital distress. Of these, the vast majority or 78 percent were considered completely urban neighborhoods (less than 1 percent of their population lived in rural areas) compared to 13.1 percent considered completely rural (where 99 percent or more of their population lived in rural areas).
The map below shows the neighborhoods in digital distress. Groups of digitally distressed neighborhoods are visible in the southwest, central, and northeastern parts of the state. Also notice these neighborhoods in urban areas such as Gary and Indianapolis. Overall, about 10 percent of Indiana’s population lived in digitally distressed neighborhoods and a little less than one-third of homes in digital distress had children.
Figure 1. Indiana neighborhoods in digital distress
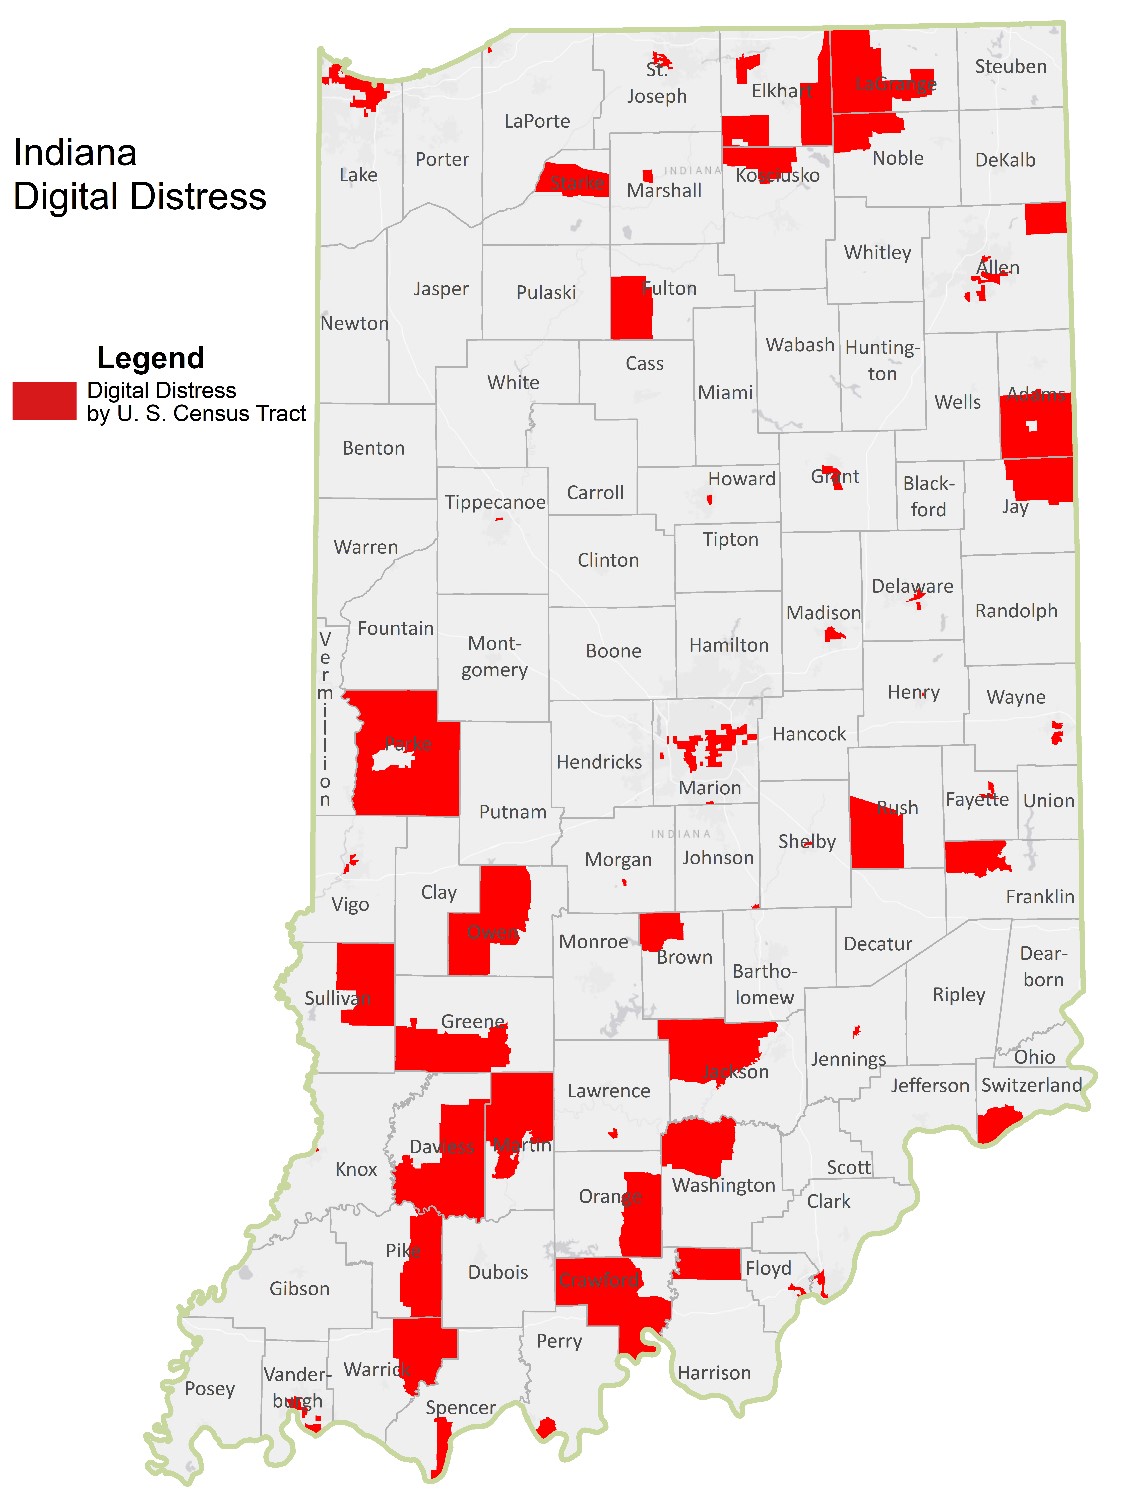
Source: PCRD; 2013-2017 5-Yr ACS
Figure below shows the percent of homes for each digital distress indicators for Indiana as a whole and digitally distressed neighborhoods. As expected, 39.2 percent of homes in digitally distressed areas had no internet access compared to one-fifth of Indiana homes. Likewise, 29.4 percent of homes in digital distress did not own computing devices compared to 14.5 percent of Indiana homes.
Figure 2. Percent homes by digital distress indicators
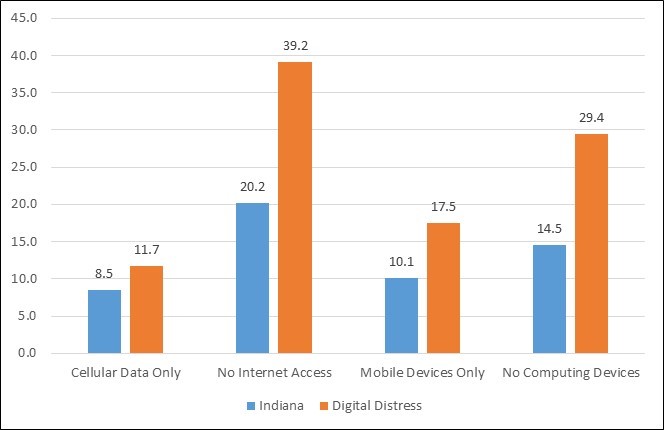
Source: PCRD; 2013-2017 5-Yr ACS
Regarding income and poverty, the population-weighted median household income in digitally distressed neighborhoods was almost one-third lower compared to the state’s ($34,581 versus $56,284) while the poverty rate was twice that of the state (29.5 versus 14.6 percent).
Figure 3. Weighted median household income
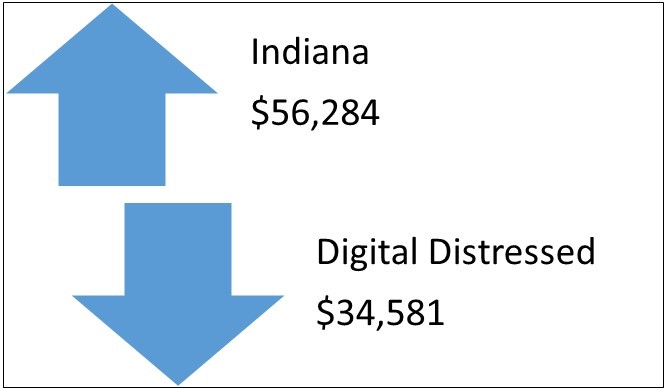
Source: PCRD; 2013-2017 5-Yr ACS
When it comes to unemployment-related figures of the prime working age population (ages 25 to 54), stark differences are also visible. As shown, unemployment was higher in digitally distressed areas (7.6 versus 4.4 percent) while about one-quarter of prime age residents were not in the labor force compared to less than one-fifth in the state.
Figure 4. Unemployment and not in labor force shares of prime working age residents
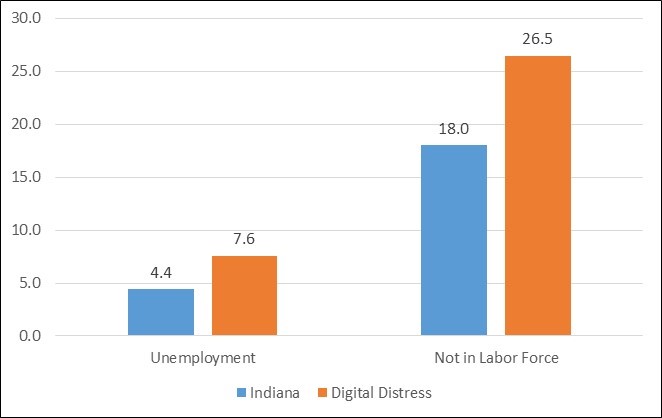
Source: PCRD; 2013-2017 5-Yr ACS
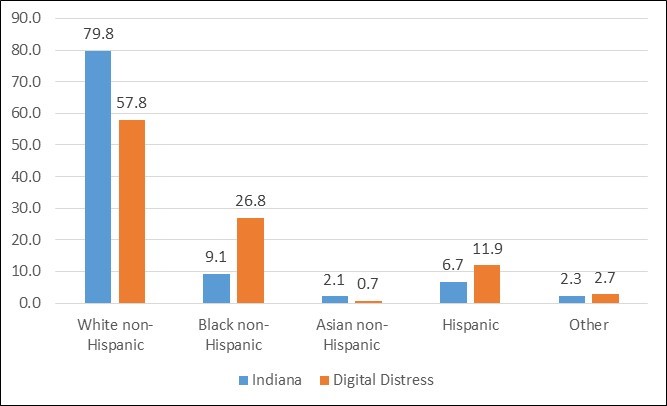
Lastly and regarding race/ethnicity, digitally distressed neighborhoods in the state had a higher share of minorities compared to the state overall. For example, the percent of white non-Hispanics in the state was close to 80 percent versus shy of 58 percent in digitally distressed neighborhoods, a twenty-two percentage point drop. Note that the black non-Hispanic share in digitally distressed neighborhoods was almost triple the share in state (26.8 versus 9.1 percent.)
Figure 5. Percent population by race/ethnicity
Source: PCRD; 2013-2017 5-Yr ACS
Additional socioeconomic characteristics about these digitally distressed areas are available under the Digital Inclusion section on the Rural Indiana Stats webpage.
To conclude, remember that children living in digital distress areas are falling behind through no fault of their own. While digital distress is not the only reason why unemployment, poverty, and income are an issue in these neighborhoods, it certainly does not help. Obviously an argument could be made that poverty leads to digital distress and not the other way around. Regardless, the fact that these areas are in digital distress does not help to improve their quality of life.
Investments such as device loan/sale programs can be implemented in partnership with libraries, businesses, and nonprofits where devices no longer used can be reformatted and offered providing affordable, more reliable computing devices. While the data does not say why internet is not accessed or subscribed to—research points to affordability, lack of availability, and/or insufficient digital literacy and skills—subsidies to afford adequate internet subscriptions as well as consistent digital literacy and skills workshops need to be part of these investments as well.
Coupled with rural broadband infrastructure investments, investing initially in digitally distressed areas will ensure all Hoosiers participate fully in this nascent digital age positioning Indiana as one of the few states with a robust digital inclusion strategy.

Roberto Gallardo is the Vice President for Engagement and an Associate Professor in the Agricultural Economics Department. He holds an electronics engineering undergraduate degree, a... read more