Navigating Indiana’s Digital Equity Landscape: Support Networks for Internet and Device Assistance

For today’s post, we look at support networks among different groups in Indiana when it comes to internet and device help. This is another snippet of Indiana’s Digital Equity Landscape series. Indiana, like all other states and territories, is going through a digital equity planning process. To better understand the digital equity context, the Purdue Center for Regional Development (PCRD) conducted a survey. For more information on the survey respondents and methodology, please read the first post of this series.
Additional number crunching found that not only the cost of internet service but also computers were the top barriers for not paying for home internet over the past 12 months. However, reasons did vary among different groups. In addition, ownership and reliability of internet home connections and devices varied between groups in Indiana. For example, the share of lower income respondents not owning a laptop was four times higher than their higher income counterparts.
The survey also found that smartphone only users in the state perceived internet benefits to be lower and were less confident of specific online tasks on average compared to non-smartphone only users. Moreover, these smartphone-only users were predominantly urban, younger, lower-income, and white non-Hispanics.
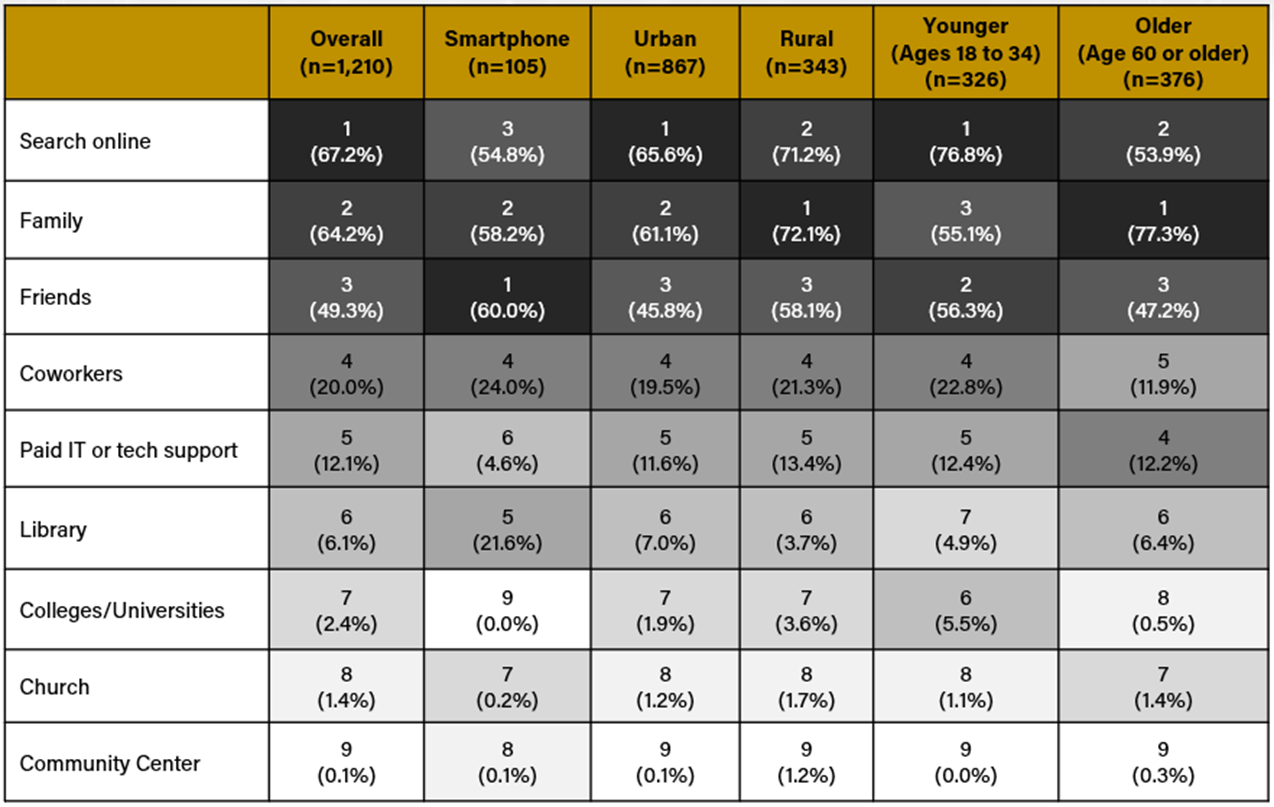
Table 1 shows the percentage of survey respondents who relied on resources when needing internet and/or device help among specific groups. The numbers in the table show the ranking of the resources by percentage of responses as well as the actual percentage in parenthesis. Further, each cell was color coded by the percentage of responses. A darker color indicates a higher percentage of responses. Several results are worth discussing.
First, when comparing overall respondents with smartphone only, we see that the latter are more likely to rely on libraries compared to the former. Also, the share of smartphone only relying on online resources was lower compared to overall respondents. This aligns with previous findings that smartphone respondents may not be leveraging the technology to its fullest.
Second, there are no major differences between urban and rural respondents other than the latter relies more on family compared to the former by more than 10 percentage points. Interestingly, the share of rural respondents relying on libraries was almost half the share of urban respondents. Perhaps this has to do with a lack of libraries in rural areas of the state.
Third, again, there are no major differences between younger and older respondents when it comes to the resources they rely on when needing internet and/or device help other than the share of younger respondents relying on online searches is more than 20 percentage points higher compared to older respondents. On the flip side, the share of older respondents going to family is also 20 percentage points higher compared to younger respondents. Both findings are not surprising and have implications for digital equity in that when targeting older folks, family is needed.
Table 1. Percentage of survey respondents listing who they typically relied on for internet and/or device help among specific groups
Lastly, the organizations included in the survey are the least go to resource regardless of group (except for libraries). This may be because these organizations may not have the capacity to provide support and/or respondents may not be aware they may have this capacity. This has tremendous implications for digital equity in that a significant effort will be needed to build capacity and/or market these organizations.
As discussed thus far, digital equity is a very nuanced landscape. Hopefully insights shared can help inform the public on what strategies or solutions are needed.

Roberto Gallardo is the Vice President for Engagement and an Associate Professor in the Agricultural Economics Department. He holds an electronics engineering undergraduate degree, a... read more


