Re-introducing the Broadband Quality Score (BQS)

The broadband landscape is very active nowadays. The federal Broadband Equity, Adoption, and Deployment (BEAD) and the Digital Equity programs are in full swing. This is in addition to the ongoing American Rescue Plan broadband infrastructure investments, additional federal programs (e.g., USDA Reconnect), and multiple state programs.
But where should these funds be invested? That is—literally—the million-dollar question. While each program defines eligibility slightly differently, the common denominator is a combination of download and upload speeds. Today, we re-introduce the Broadband Quality Score or BQS as another way to measure not only binary yes/no access but also quality service.
While download and upload speeds indicate the network’s data carrying capacity, and both have documented its impact on broadband use, latency gets more at how responsive the network is. Latency—defined as the time delay between two systems—is crucial for real-time applications, such as finance and online experience in general. Studies have found that increases in latency affects sales and website traffic.
In fact, the worldwide renowned speed test platform Ookla defines it as the next “frontier of consumer experience.”
The BQS was first introduced in 2010 by two Spanish researchers. Their reasoning was that penetration, or yes/no access was not enough, and that quality and capacity should be considered as well when defining a digital divide. Based on their work, this article calculates an updated BQS including three variables: average download in megabits per second (Mbps), average upload in Mbps, and average latency in milliseconds (ms).
Using the annual average quarterly data from the Speedtest® by Ookla Global Fixed Network Performance Maps, a BQS was calculated for every Census tract and county with 50 or more speed tests (to reduce impact of outliers). Based on the work of the Spanish researchers, the BQS formula utilized was: BQS = Avg. Download * 0.45 + Avg. Upload * 0.32 – Avg. Latency * 0.23. Note that faster download and upload speeds contribute to a quality connection and hence add to the BQS while a higher latency denotes a slower responsiveness, thus a higher or slower latency is subtracted from the BQS.
The final BQS was then normalized to a range of 0 to 100, by indexing relative to minimum and maximum values across the sample. Therefore, a value of 100 indicates the best broadband quality score and 0 the worst. Lastly, counties were then divided into three equal groups of roughly 1,030 counties each with low, moderate, and high BQS.
Unfortunately, there is no recent research to help assign other weights to these variables. However, the fact that latency is now included—regardless of the weight assigned—provides a different picture of the digital divide. The socioeconomic analysis was conducted by assigning the BQS scores to counties using the American Community Survey Five-Year dataset (2018-2022).
Due to data availability—no speed test data or number of speed tests was less than 50—a total of 3,113 counties (out of 3,144) or 99% of all counties were included in the analysis. The figure below shows a map of U.S. counties by BQS group as well as the underlying variables (hover each county). Note how North Dakota has a significant number of counties with a high BQS while southwest Alabama, Texas, and West Virginia have several counties with a low BQS.
Regarding metropolitan or nonmetropolitan counties and based on the latest Rural-Urban Continuum Codes, 84% of the counties in the low BQS group were nonmetropolitan—defined as counties with an urban population of 20,000 or less, adjacent and non-adjacent to metropolitan counties. For the high BQS group, close to two-thirds were metropolitan—defined as counties in metro areas with a population of less than 250,000 to 1 million or more—compared to a little more than one-third being nonmetropolitan counties. In other words, the urban rural divide continues when looking at the broadband quality divide.
When it comes to race/ethnicity, a slightly different picture emerges. Three-quarters of residents in low BQS counties were white, non-Hispanic compared to close to 59% in high BQS counties. On the other hand, a little less than one-quarter of residents in low BQS counties were minorities compared to a little more than 40% in high BQS counties. To put it differently, a larger share of residents in low BQS counties were white, non-Hispanic.
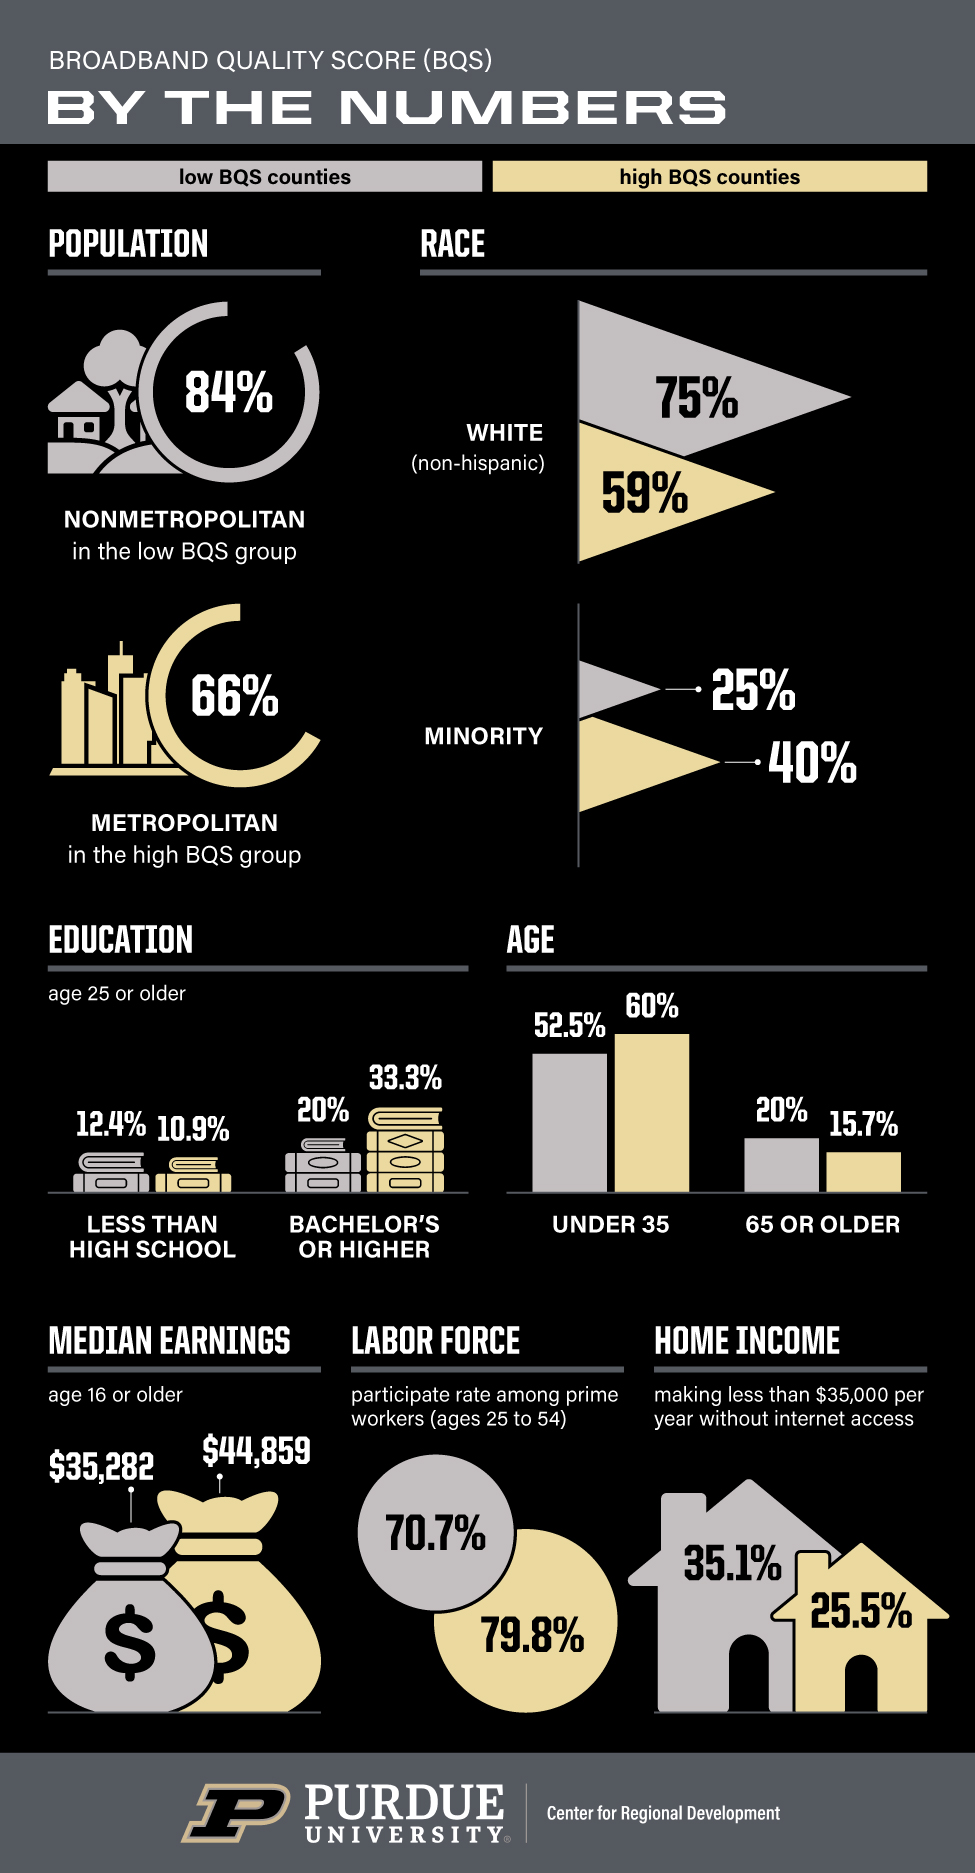
About educational attainment, the share of residents ages 25 or older with less than high school in both low and high BQS was almost the same at 12.4% versus 10.9%, respectively. However, when looking at those with a bachelor’s or more, a different picture emerges where in low BQS counties, less than one-fifth had a bachelor’s degree or higher compared to more than one-third in high BQS counties. Regarding age groups, 52.5% of residents in low BQS counties were under age 35 compared to close to 60% in high BQS counties. On the other hand, more than one-fifth of residents in low BQS counties were age 65 or older compared to 15.7% in high BQS counties.
Furthermore, the median earnings of those ages 16 or older in low BQS counties was $35,282 (weighted by population) versus $44,859 in high BQS counties. Likewise, the labor force participation rate among prime workers (ages 25 to 54) was ten percentage points higher in high BQS counties compared to low BQS counties, or 79.8 versus 70.7 respectively. Lastly, the share of homes making less than $35,000 per year without internet access was 35.1% compared to 25.5% in high BQS counties.
The digital divide based on broadband quality does not differ much to the “traditional” digital divide or a mostly binary yes/no issue. In general, counties with lower broadband quality were rural, older, less educated, earned less, had lower labor force participation rates, and a higher household internet access inequity. The only difference was when it came to race/ethnicity where a larger share of residents in low BQS were white, non-Hispanic compared to minorities.
While the directionality of the issue should be kept in mind—where socioeconomic factors affect broadband quality and not the other way around, at the end of the day, not having quality broadband results in communities not being able to fully participate in an ever-increasing digital society and economy.
Research has found that places—compared to people—have a harder time escaping downward pressures effectively neutralizing available equilibrating mechanisms. In other words, this can effectively “disconnect” communities from economic and social ties resulting in persistent poverty. Given that broadband is highly sensitive to location, the digital divide is, unfortunately, contributing to this “disconnect.” Hopefully the ongoing and pending broadband investments will begin to bridge this divide.

Roberto Gallardo is the Vice President for Engagement and an Associate Professor in the Agricultural Economics Department. He holds an electronics engineering undergraduate degree, a... read more


