What’s new with Rural Indiana Stats?

Written by Benjamin St. Germain and Bo Beaulieu.
The Purdue Center for Regional Development (PCRD) continues to update its online data platform, Rural Indiana Stats (RIS). This year is no different given that nearly all 130+ variables that are available on the RIS site have been updated with the newest data available. The major data products within RIS include county geographic typologies, housing characteristics, local government fiscal information, socioeconomic characteristics, agriculture & forestry, and digital inclusion. The partnership between PCRD and the Indiana Office of Community and Rural Affairs (OCRA) that was instrumental in launching the site over four years ago continues to this day.
This year’s RIS update has a number of changes and new additions present throughout the platform. One major addition to RIS is the remote work / E-learning vulnerability dashboard. This dashboard is accessible in the Digital inclusion portion of RIS. With a growing segment of the Hoosier labor force working in some capacity from home or remotely, an effort was made to assess the readiness of Indiana counties to accommodate this shift. The dashboard showcases how each county is faring with respect to digital vulnerability.
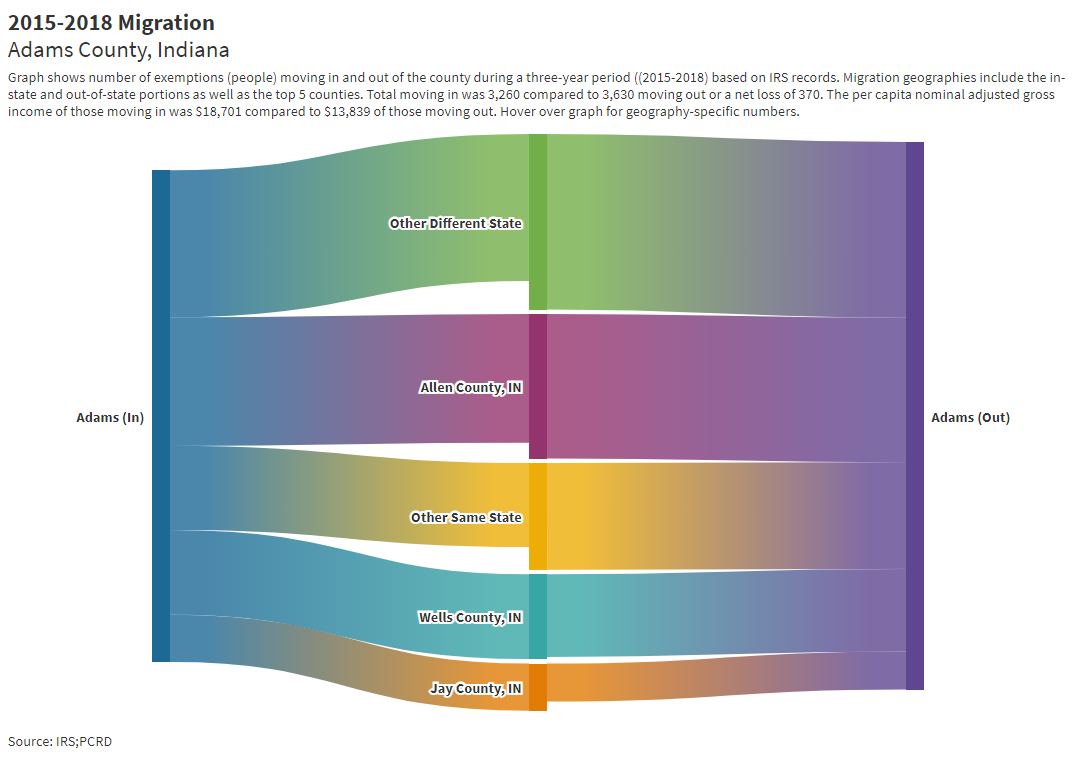
Within the agriculture & forestry section of the platform, the cropland area map and dashboard have been updated with the most recent data from the National Agricultural Statistics Service (NAAS). With this addition, users can use the popups inside of the cropland map to quickly see what crops have gained or experienced declines on a year-by-year basis from 2010-2020. Another new addition is the inclusion of migration charts. These charts show the movement of people moving in and out of each county during a three-year period. In addition, the charts capture the per capita nominal adjusted gross income of those moving in and out. Lastly, the cultural & environmental amenities maps are now available in a dashboard format, this is more user-friendly and likely to help identify important assets located in close proximity to people’s places of residence.
RIS represents a valuable tool for any Hoosier looking to find specific data on any of the state’s 92 counties. It is designed to provide individuals, leaders, organizations, and agencies with ready access to a core set of data for informing and guiding local programs, projects and investment activities. Data from RIS in the past has been used to support the development of local and regional comprehensive economic development strategies (CEDS), to shape place-based workforce attraction plans, to guide the effort of local economic development organizations, and to validate problems/issues being addressed in a variety of grant applications. As for specific examples, the Indiana Housing and Community Development Authority is utilizing the RIS data on housing to help determine which grant applications submitted to the state agency should be funded. Select members of the Indiana Association of Regional Councils are tapping the digital inclusion data to inform local, state and national officials of the broadband-related needs of their regions. Furthermore, the Office of Community and Rural Affairs is using the geographic typologies to ensure that resources designed to lend assistance to rural Indiana communities are being targeted to the right places.
Since RIS’s inception in the spring of 2017, the active number of people accessing the website continues to climb to more than 11,000 users and tens of thousands of page views. As PCRD strive to continue to make key data available to support the well-being of people, communities and regions in the state, we welcome feedback from users as to the type of secondary data you have found most useful and what data variables you would recommend be added to the RIS site in the future.
To find the all the data visit Rural Indiana Stats today!

Benjamin St. Germain is a GIS Analyst for the Purdue Center for Regional Development, joining the staff in 2015. Benjamin uses a variety of data... read more


