2019 Digital Divide Index (DDI)

We are happy to announce the release of the 2019 digital divide index. This updated version keeps the three scores you are familiar with: overall digital divide index, infrastructure/adoption, and socioeconomic. These scores still range from 0 to 100, where a higher number indicates a higher divide either from an infrastructure/adoption perspective or socioeconomic. In the end, the DDI is comprised of ten indicators. For more information on the indicators and how the scores can be interpreted please go to 2019 Digital Divide Index (DDI) (arcgis.com).
For purposes of this post, we divided all census tracts in the country, whose DDI could be calculated, into three equal groups (roughly same number of tracts per group) based on their DDI score: low, medium, and high.
Of the roughly 324 million residents in the U.S. according to the 2015-2019 ACS survey, 123 million or 38% lived in tracts with a low digital divide versus 108 million or 33% in tract with a medium digital divide and 92 million or 28% in tracts with a high digital divide. In terms of age, roughly 21 million or 29% of children and 16 million or 32% of those ages 65 or older lived in tracts with a high digital divide.
Regarding household density, tracts with a low digital divide had on average 187 households per square mile compared to 54 in areas with a medium digital divide and 14 in areas with a high digital divide. In other words, denser areas had a lower digital divide.
Figure 1. Household Density per Square Mile by Digital Divide Groups
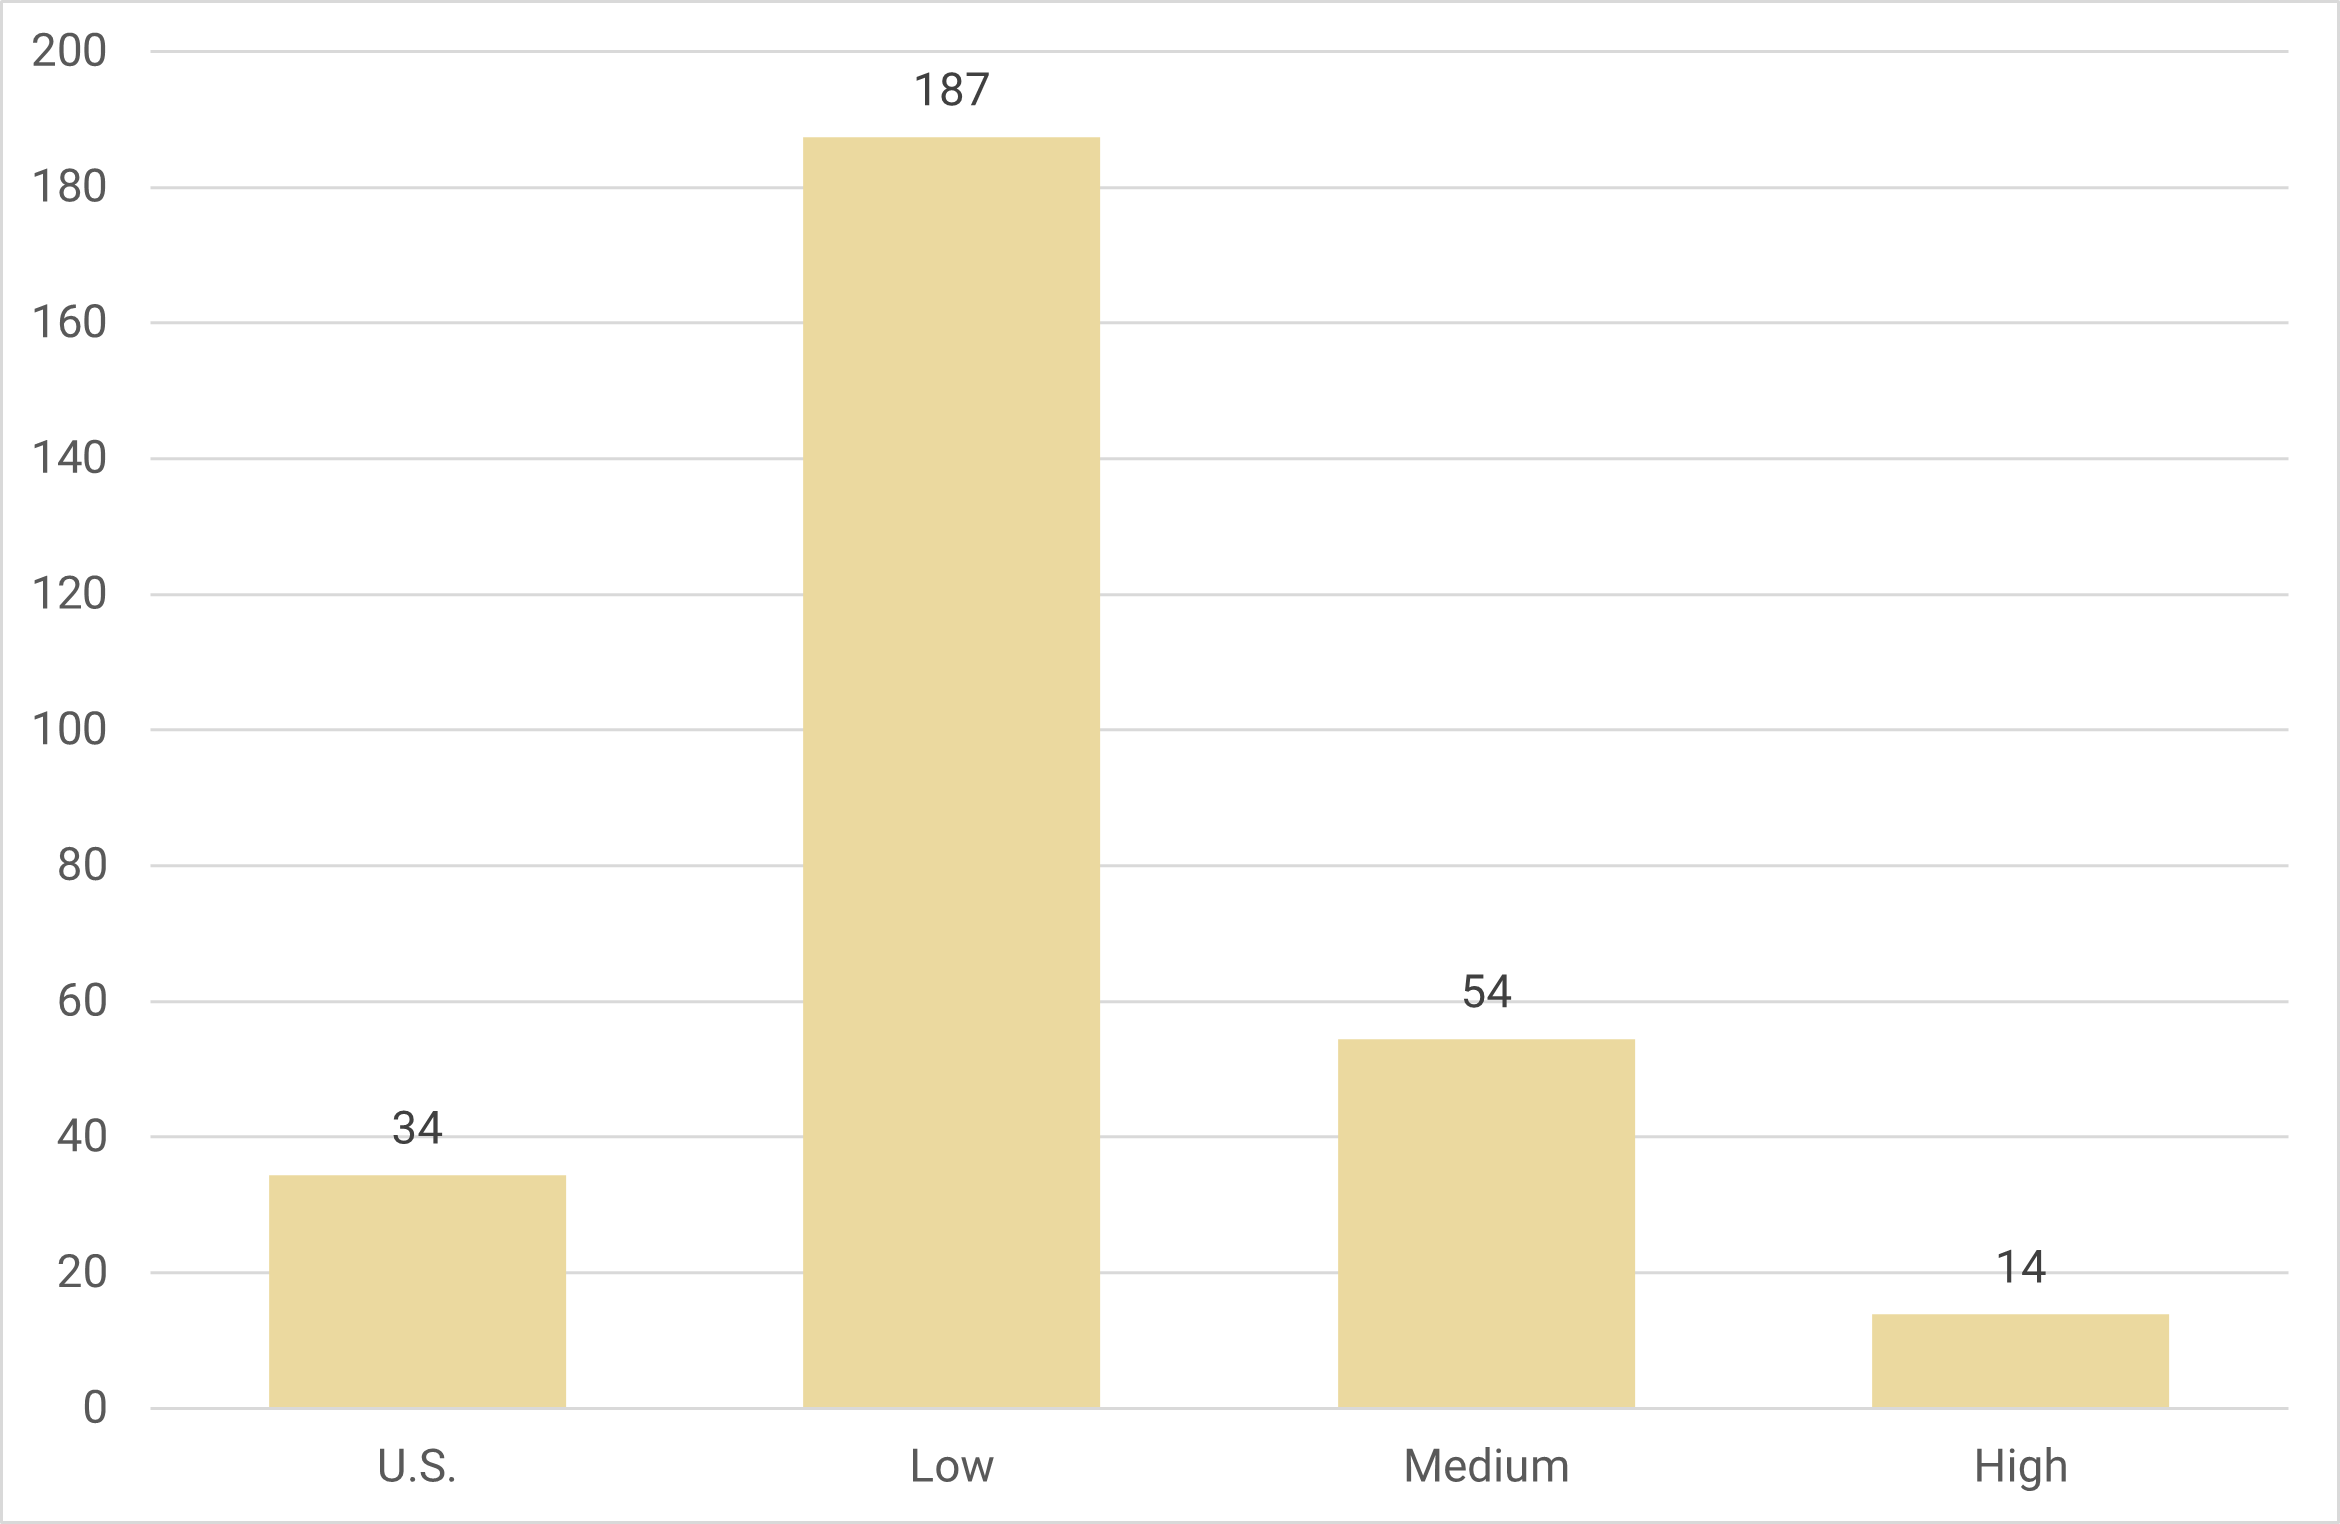
Source: PCRD; ACS 2015-2019
In terms of racial and ethnic diversity, census tracts with a low digital divide had a diversity score—ranges from 0 to 100 where a higher number denotes a more diverse population based on eight mutually exclusive racial and ethnic categories available in the census—of 54.9 versus 56.7 in tracts with a medium digital divide and 62.1 in tracts with a high digital divide. In other words, tracts with a high digital divide had a higher share of minorities. On another note, Figure 2 shows the individual poverty rate by DDI group. Notice how one-fifth of individuals in tracts with a high digital divide were poor compared to 7% of those in tracts with a low digital divide.
Figure 2. Individual Poverty Rate by DDI Group
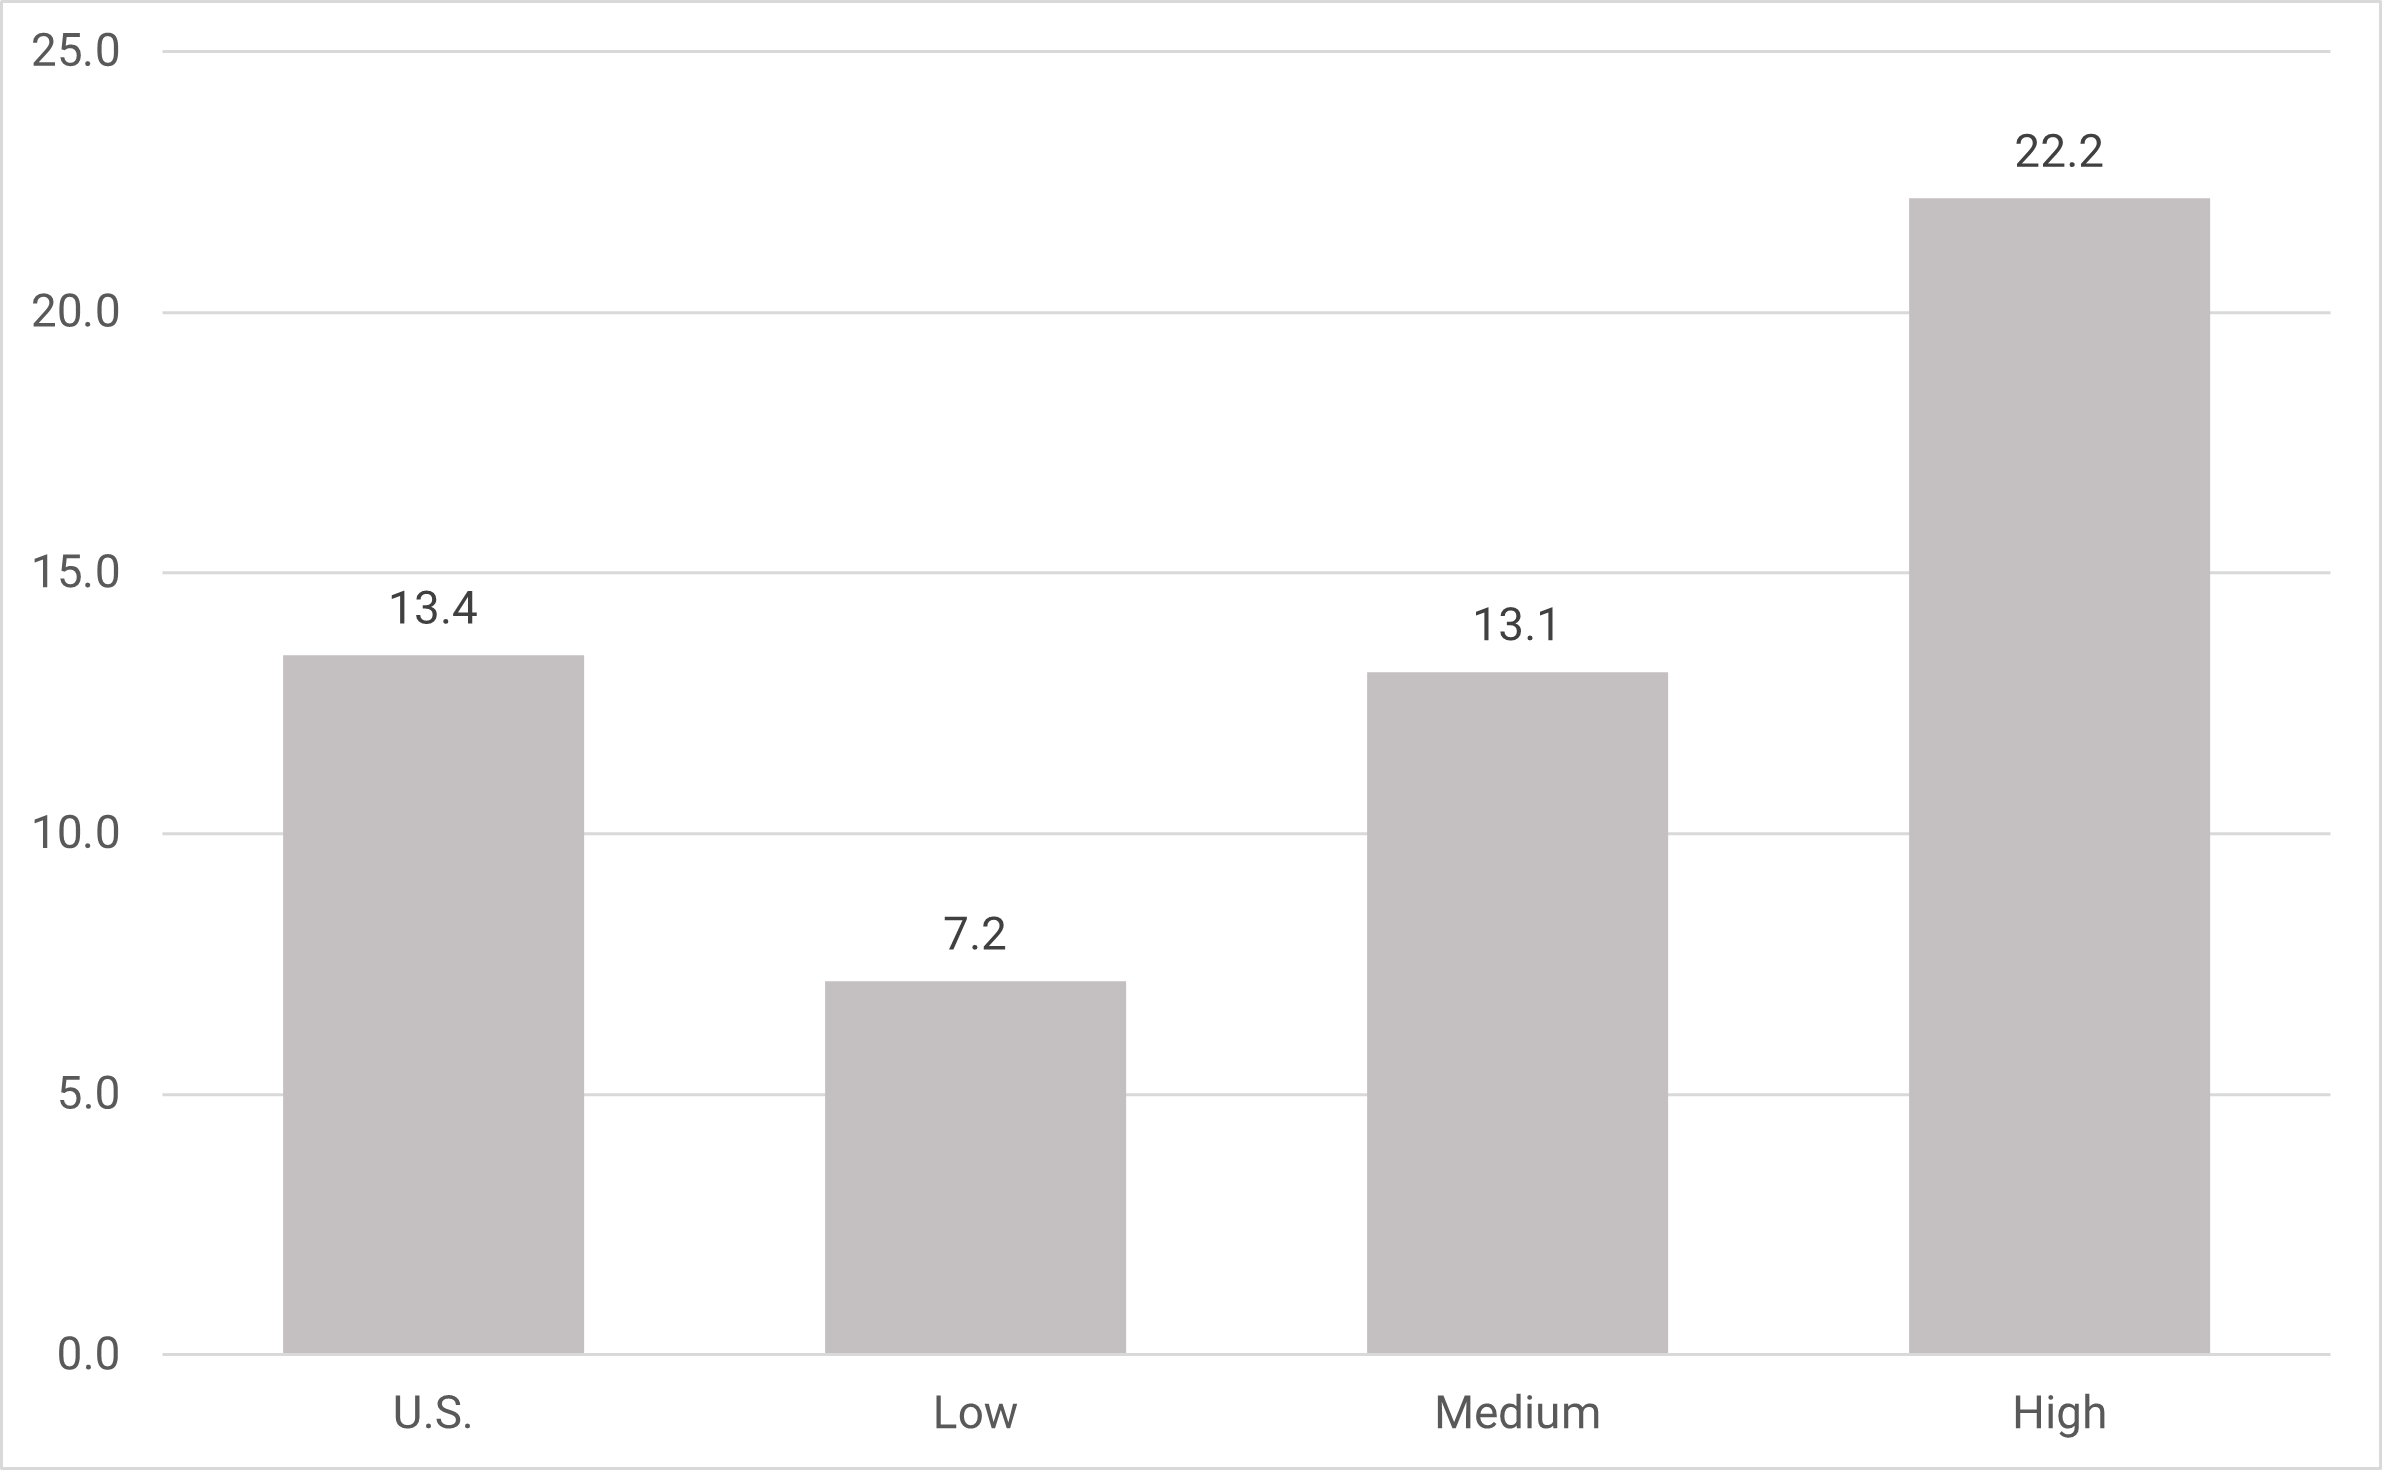
Source: PCRD; ACS 2015-2019
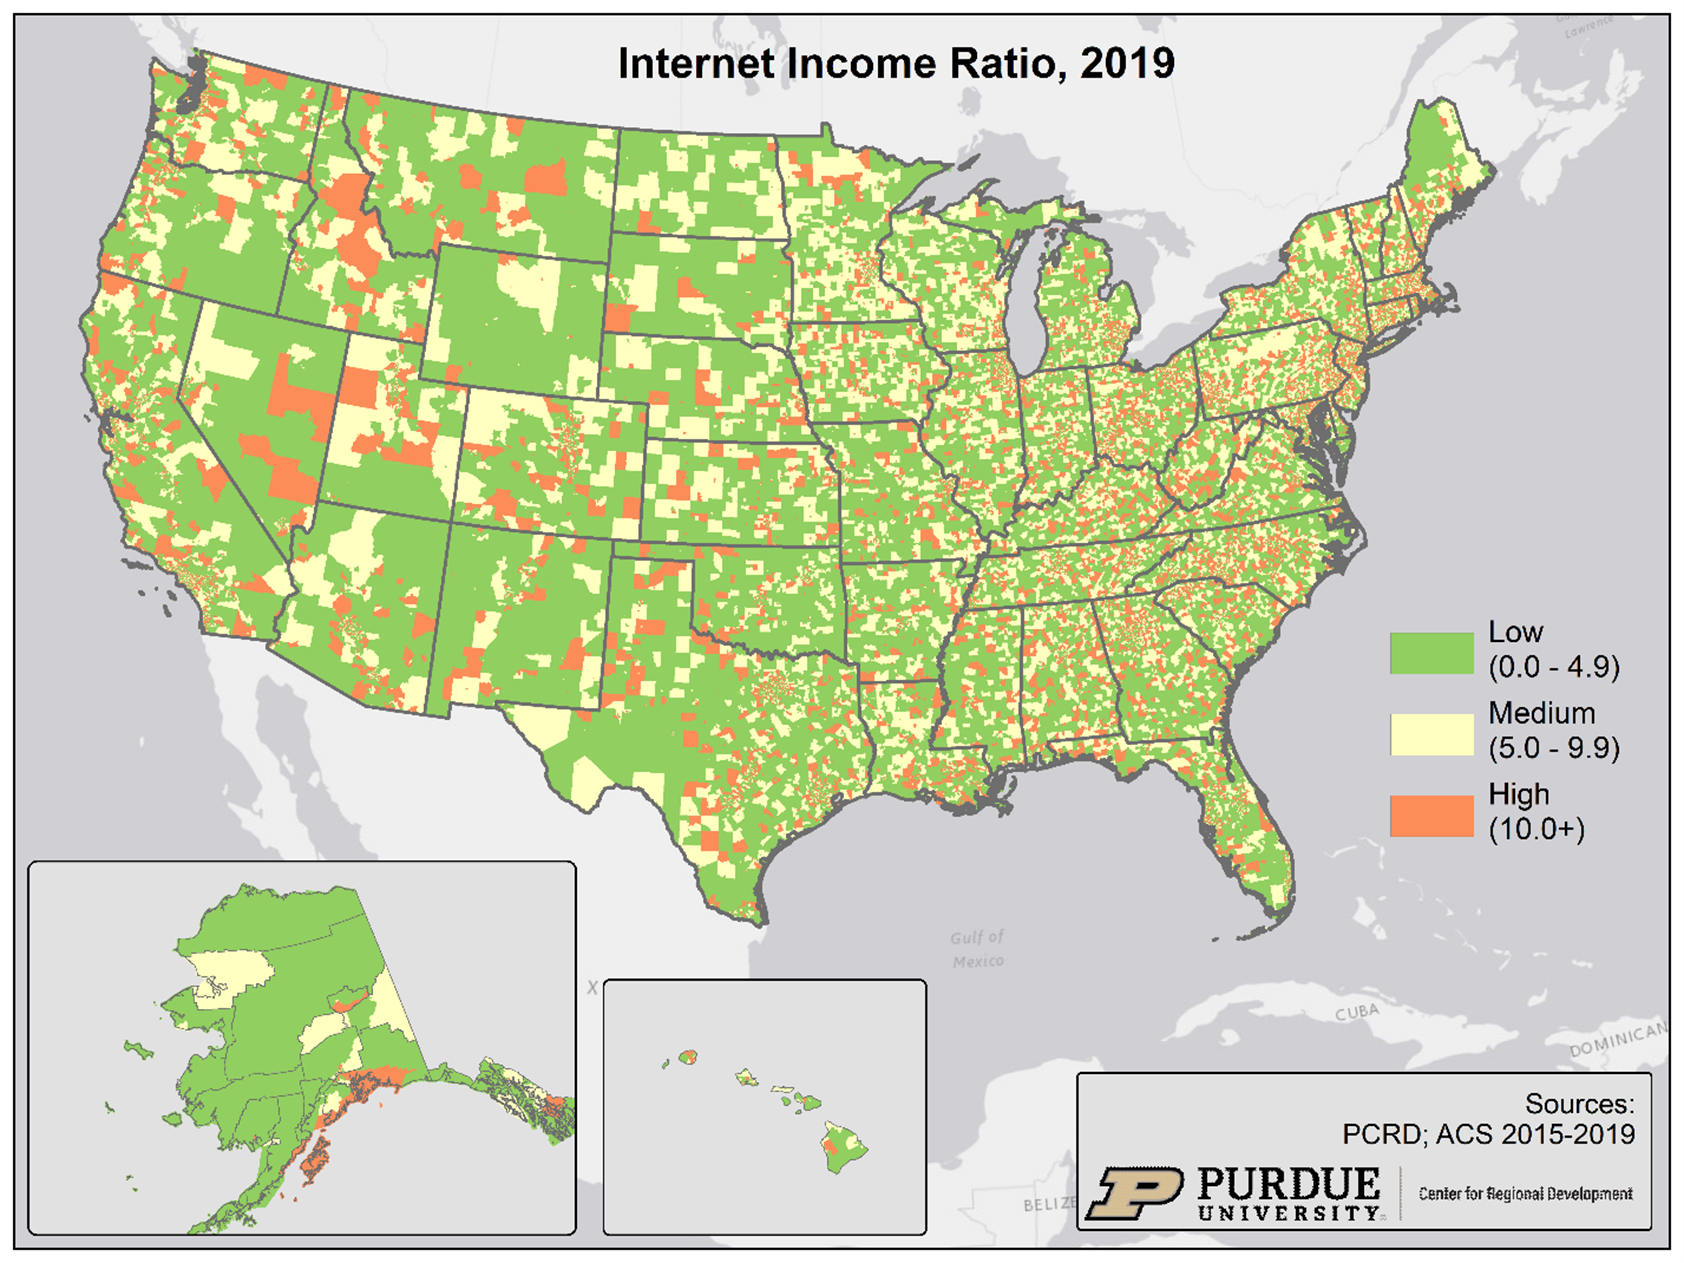
For this new version, however, we have incorporated a new indicator under the socioeconomic bucket called the internet income ratio, or IIR. The IIR is calculated by dividing the share of homes making less than $35,000 per year without internet access by the share of homes making $75,000 or more per year without internet access. In other words, the higher the IIR, the higher the inequality on internet access based on household income.
Figure 3 shows census tracts in the nation divided into low, medium, and high based on their IIR. Areas in red show an IIR larger than 10 while areas in yellow show an IIR between 5 and 10. For example, an IIR of 5 means that the share of lower income households without internet is five times higher compared to the wealthier share of homes without internet.
Figure 3. IIR at the Census Tract Level Divided Into Low, Medium, and High
Feel free to take a deeper look at the latest version of the digital divide index. Analysis here was not meant to be comprehensive. Rather, show how this resource can be used to obtain valuable insights around this topic.
The 2019 DDI Indiana version will be released soon in our ruralindianastats.com website. Check back soon!

Roberto Gallardo is the Vice President for Engagement and an Associate Professor in the Agricultural Economics Department. He holds an electronics engineering undergraduate degree, a... read more


