Exploring Economic Geography of Semiconductor Sectors in the U.S. (Part I)
Co-authors: Indraneel Kumar and Ben St. Germain
Semiconductors are of significant interest in the U.S., especially in terms of investments, economic opportunities, and global security. The North American Industry Classification System (NAICS) defines semiconductors in two specific 6-digit codes. The first is NAICS 334413 or semiconductor and related device manufacturing and the second one is NAICS 333242 or semiconductor machinery manufacturing. As per American Integrated Economic Survey (AIES), NAICS 334413 or semiconductor and related device manufacturing value-added to the U.S. economy was $33.9 billion in 2023 and $32.6 billion in 2024, respectively. Similarly, AIES data show that value-added by NAICS 333242 or semiconductor machinery manufacturing was $7 billion in 2023 and $7.5 billion in 2024, respectively. The value-added estimates are in fixed 2024 dollars.
Note that starting from 2023, AIES has consolidated and replaced seven annual business surveys conducted by the U.S. Census Bureau. These surveys included Annual Survey of Manufacturers, Annual Retail and Wholesale Trade Surveys, Surveys for Services and Annual Capital Expenditures, and other surveys related to manufacturers’ unfilled orders and report of organizations.1 Considering that Bureau of Economic Analysis (BEA) does not provide detailed GDP estimates for 6-digit NAICS industry sectors, value-added estimates from AIES are approximations for GDP contributions of semiconductor-related industry sectors at the national level. The estimates from Lightcast reveal that semiconductor and related device manufacturing (NAICS 334413) had nominal GDP contributions of $91.2 billion (0.32%) and $72.7 billion (0.27%) at the national level in 2024 and 2023, respectively. For semiconductor machinery manufacturing (NAICS 333242) nominal GDP contributions were $8.8 billion (0.03%) and $7.9 billion (0.03%) in 2024 and 2023, respectively.
For NAICS 334413 or semiconductor and related device manufacturing the Quarterly Census of Employment and Wages (QCEW) jobs varied from 181,668 in 2010 to 197,020 in 2025, an increase of 8% in the 15-year period. In contrast, NAICS 333242 or semiconductor machinery manufacturing, the QCEW jobs changed from 14,610 in 2010 to 29,292 in 2025, nearly 100% increase in the 15-year period. Figure 1 reveals year-over-year jobs in semiconductor and related device manufacturing in the U.S. Two periods of growth cycles from 2010 to 2012 and 2021 to 2024 are visible in the line chart. The employment in semiconductor and related device manufacturing peaked at 203,782 jobs in 2024 in the U.S. A stagnant period from 2015 to 2020 followed by growth spurt of 2021 to 2024 can be explained in part that after the post Great Recession period of 2008-2009, there was a separation between design and fabrication or manufacturing. The research and design and fabless activities were happening in the U.S., whereas fabrication and manufacturing were offshored to other countries. The growing demand for electronics after COVID-19, domestic manufacturing boost by CHIPS Act of 20222, and new investments can explain in part the growth in jobs after 2020.
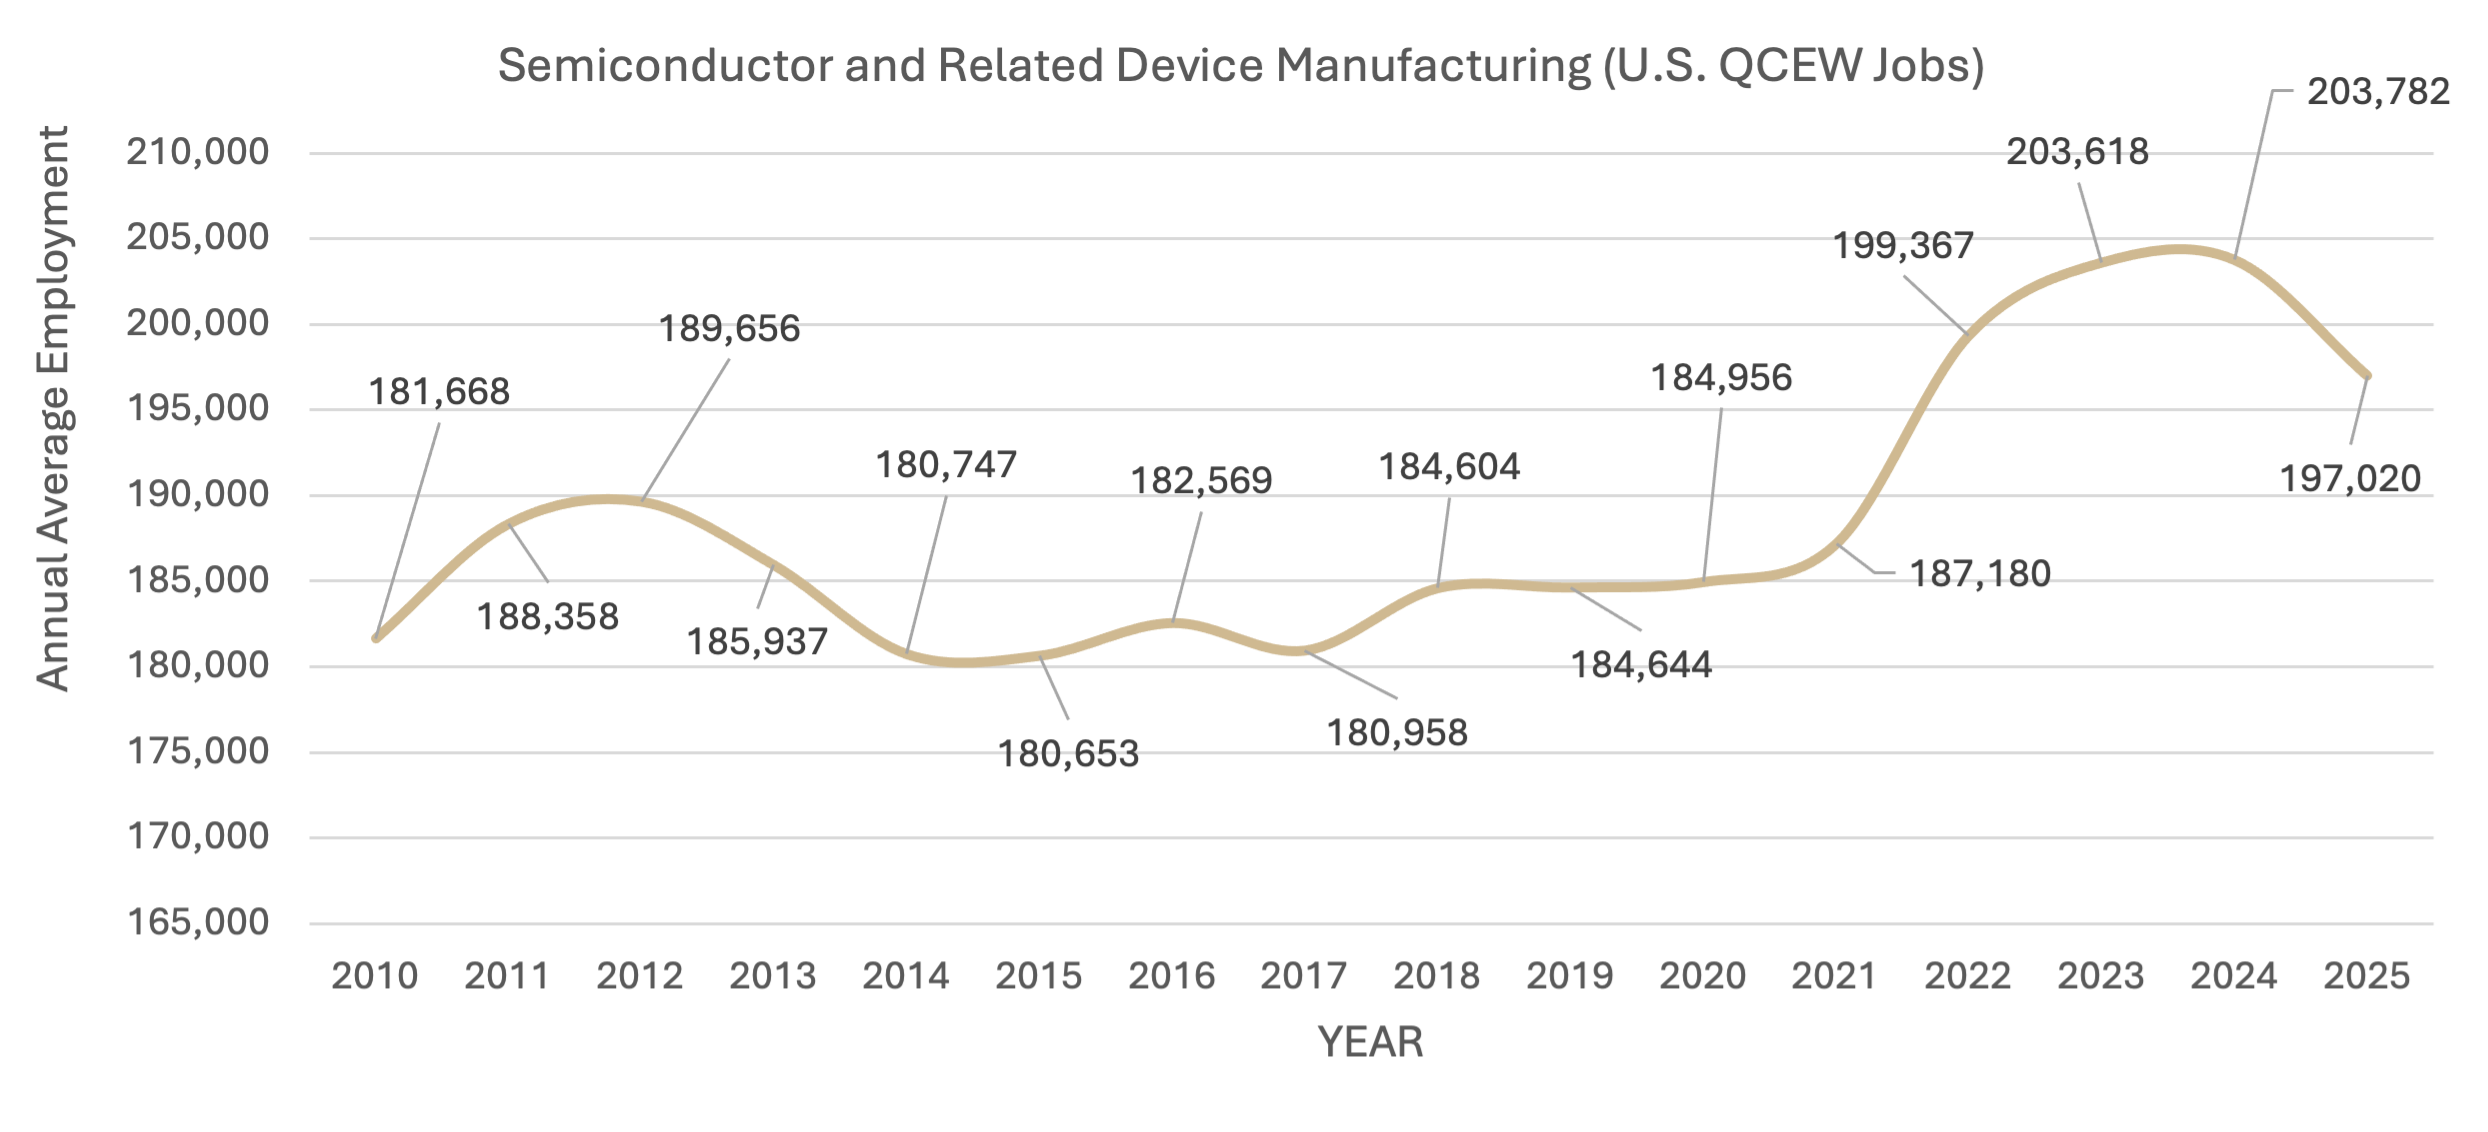
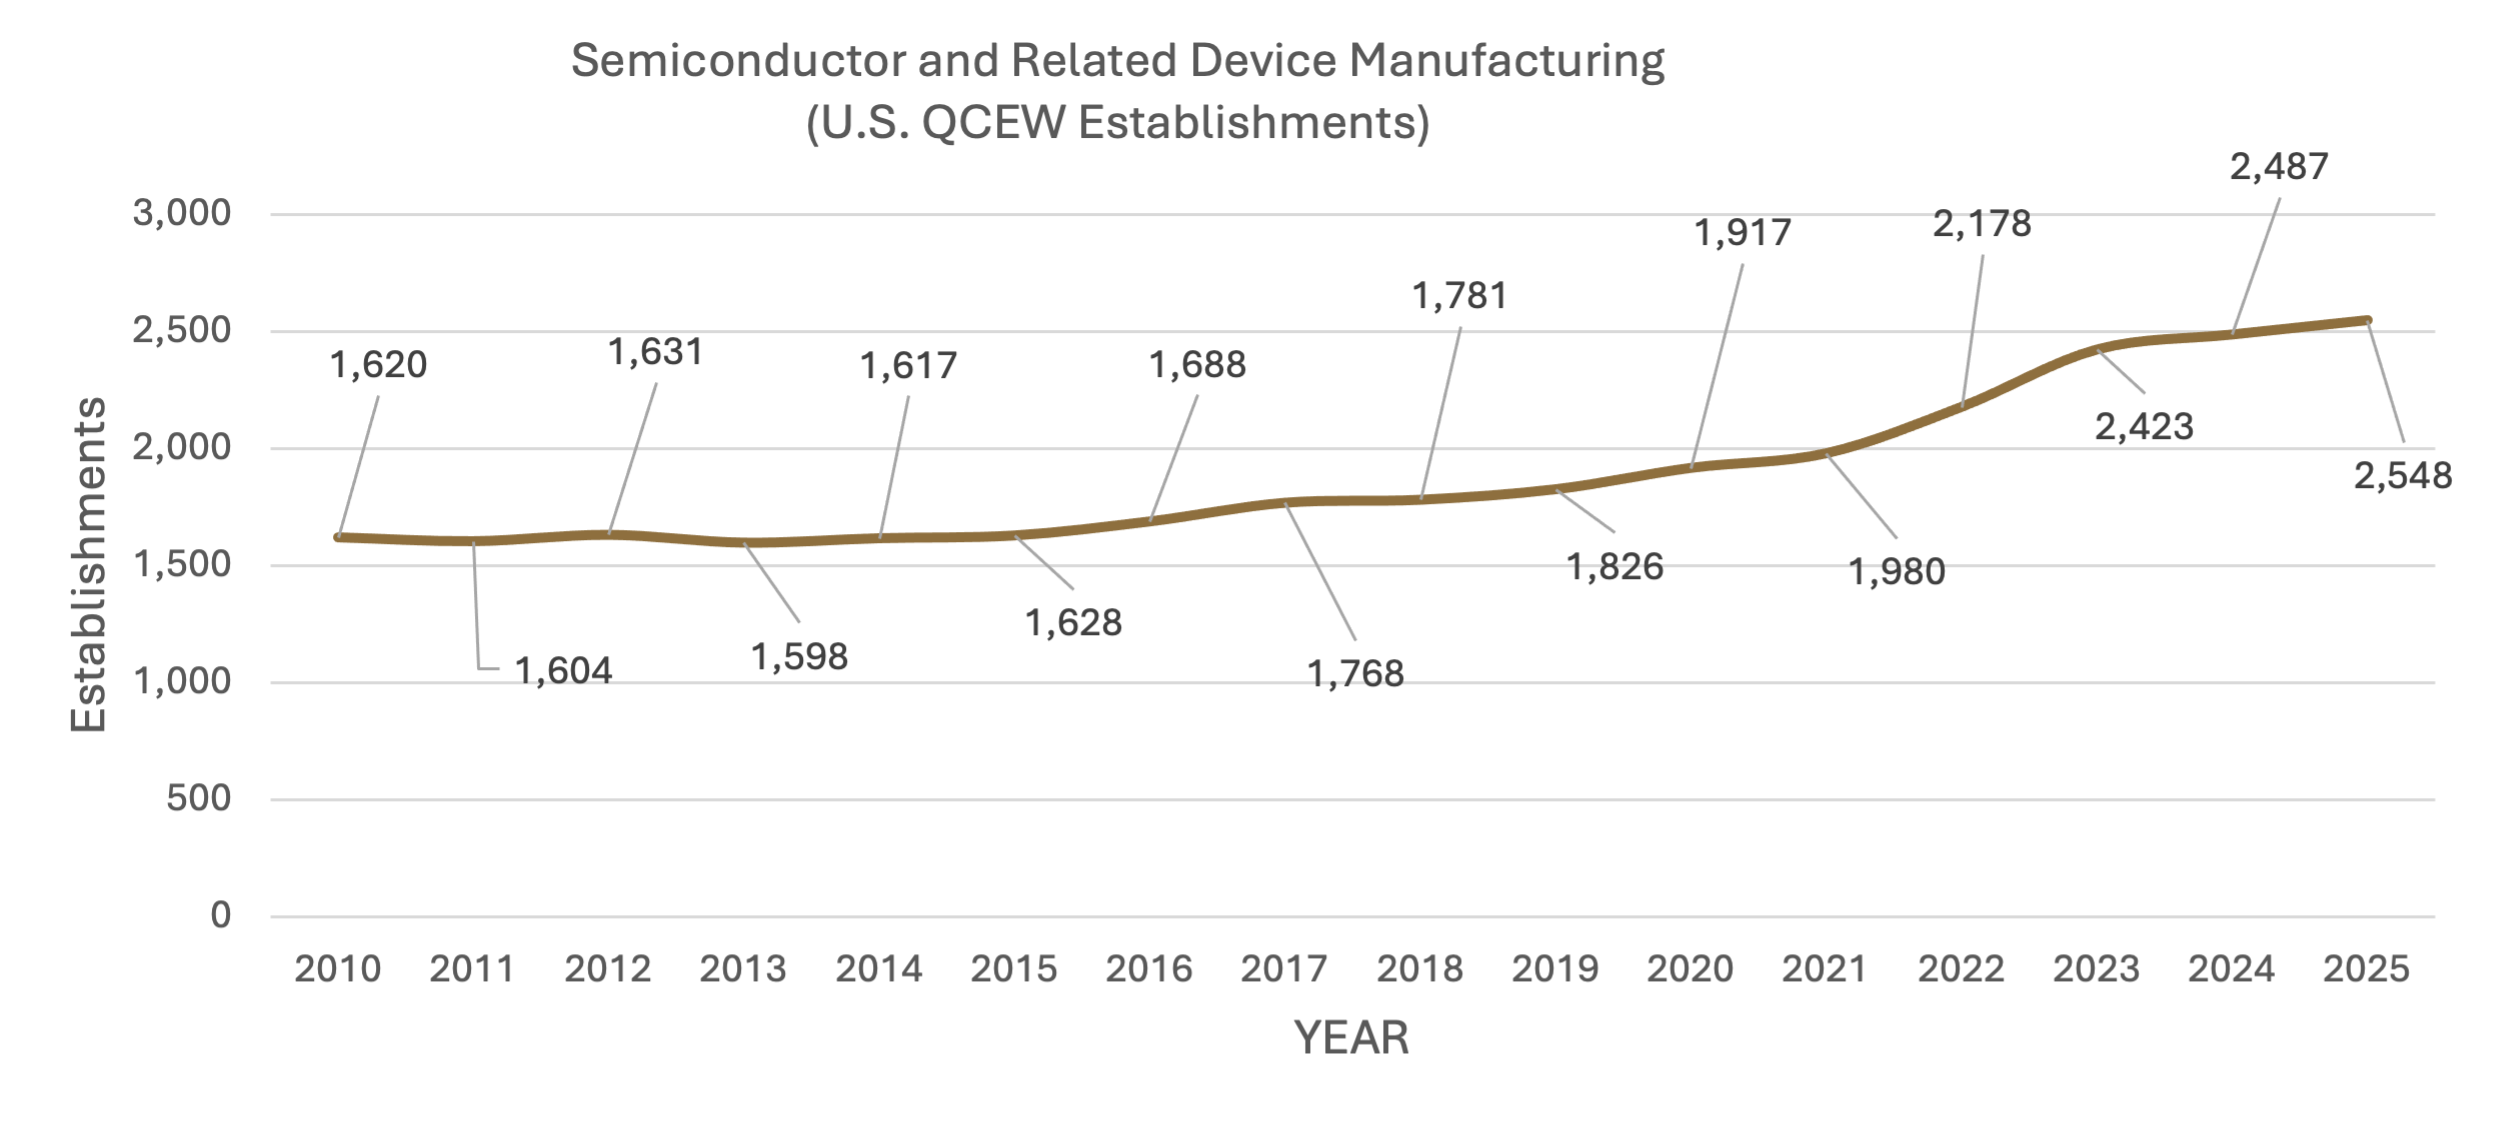
Figure 2 shows year-over-year establishments in semiconductor and related device manufacturing in the U.S. The trend line shows continuous, but slow growth in establishments in the last 15 years. The establishments peaked at 2,548 in 2025 in this important industry sector. This trend is at par with the investments, legislation, and interest in growing semiconductor ecosystem within the U.S.
Interactive online charts for jobs and establishments in semiconductor and related devices manufacturing are available here. Note that charts are based on QCEW, BLS (Bureau of Labor Statistics) data.
Year-by-year job change in semiconductor and related device manufacturing
Year-by-year establishment change in semiconductor and related device manufacturing
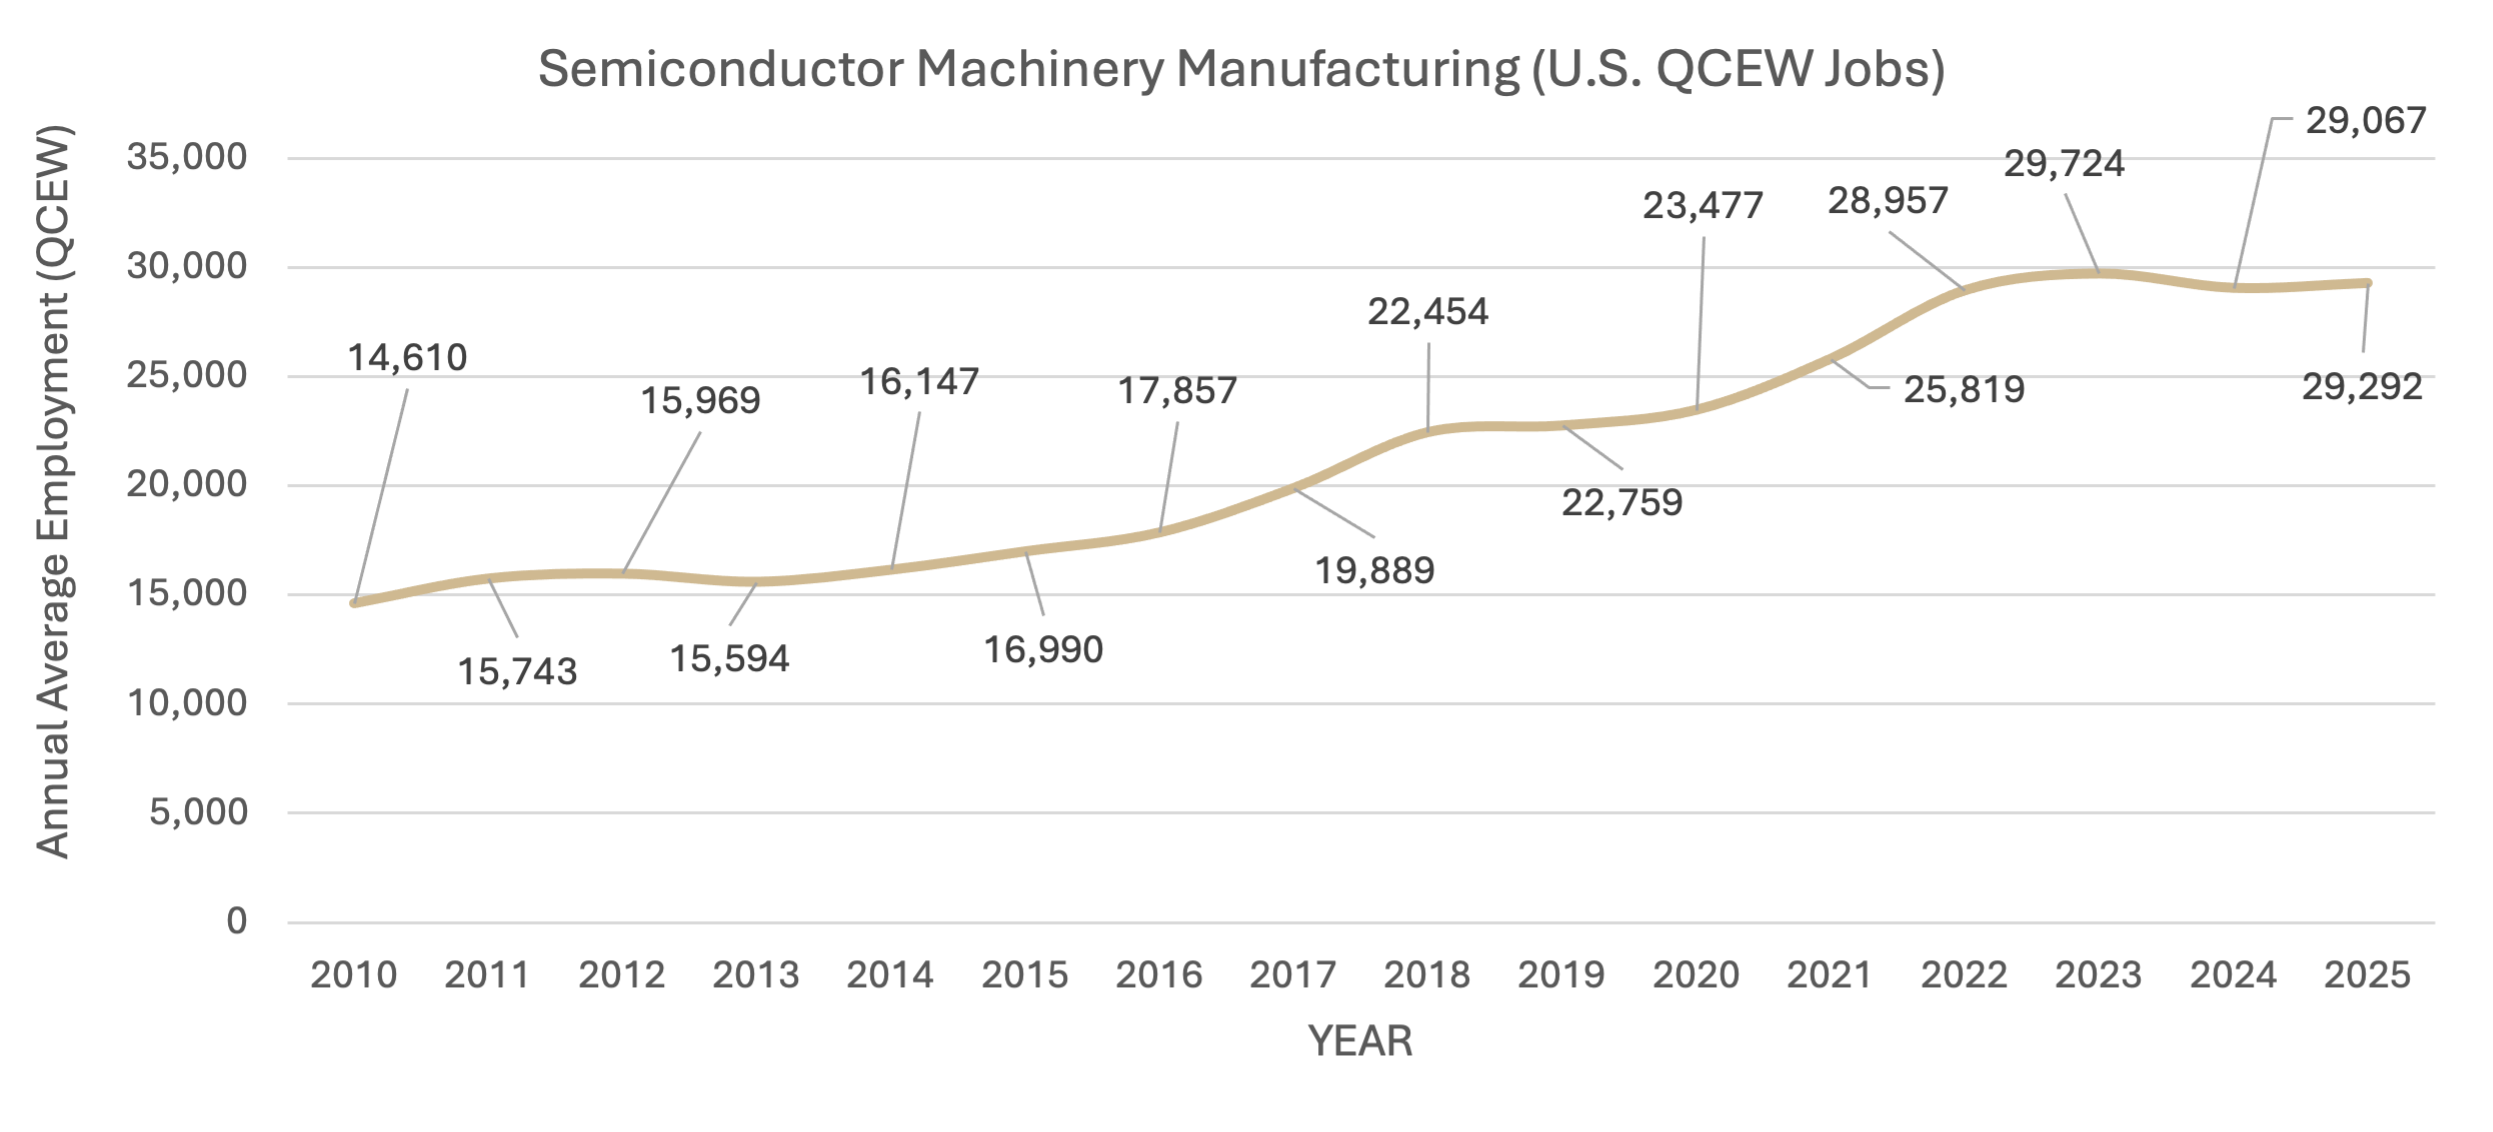
Unlike semiconductors and related devices’, industries in the semiconductor machinery manufacturing engage in manufacturing machinery equipment needed for semiconductors. Examples include semiconductor making machinery, semiconductor assembly and packaging machinery, wafer processing equipment, vapor deposition equipment manufacturing, etc.3 Figure 3 shows year-by-year changes in jobs in semiconductor machinery in the U.S. The trend reveals continuous growth over 15-year period however, the industry had a peak employment of 29,724 jobs in 2023. The establishments also increased from 228 in 2010 to 438 establishments in 2025, nearly 92% growth in 15 years. The post-pandemic growth in global investments can explain in part the growth in U.S. manufacturing of semiconductor machinery equipment as the high growth period took place before CHIPS Act as shown in Figure 3.4 The investments and legislative support of CHIPS Act has kept the jobs, in part stabilized after 2022.
The semiconductor ecosystem is diverse. An important ingredient in semiconductor value chain is quartz, a naturally occurring mineral comprised of silicon and oxygen. The Spruce Pine in North Carolina holds a significant position in global semiconductor supply chain as it produces ultra-high purity of quartz needed for advanced semiconductor wafers and devices. As per North Carolina Economic Development Partnership, Spruce Pine is the only viable source of ultra-high purity quartz5, exceeding 99.999% silicon dioxide in the world. The quartz from Spruce Pine is used to develop high purity crucibles to process the silicone.6 These industrial activities of mining and processing fall under NAICS 212390 (other nonmetallic mineral mining and quarrying) and NAICS 327992 (ground or treated mineral and earth manufacturing). Spruce Pine is in an economic development district (EDD) known as High Country Council of Governments in North Carolina. Here, we explore the industry clusters of “High Country Council of Governments” by using the Regional Clusters dashboard7.
To examine data for the High Country Council of Governments EDD, navigate to RegionalClusters.com and open the Industry Cluster Dashboard. Select North Carolina, then choose the High Country Council of Governments EDD. The dashboard provides an at-a-glance view of the region by individual industry cluster. Start with Mining and Quarrying (Except Fossil Fuels), which has 604 jobs, a location quotient (LQ) of 2.27, and weighted average annual earnings of $92,637 in 2023. The LQ compares a cluster’s percent share of total regional employment with its percent share of national employment, indicating the region’s degree of specialization. An LQ of 1 means the regional and national employment percent shares are equal. Because this cluster’s LQ is 2.27, it is more than two times concentrated than the national average, hence, it is specialized in the region.
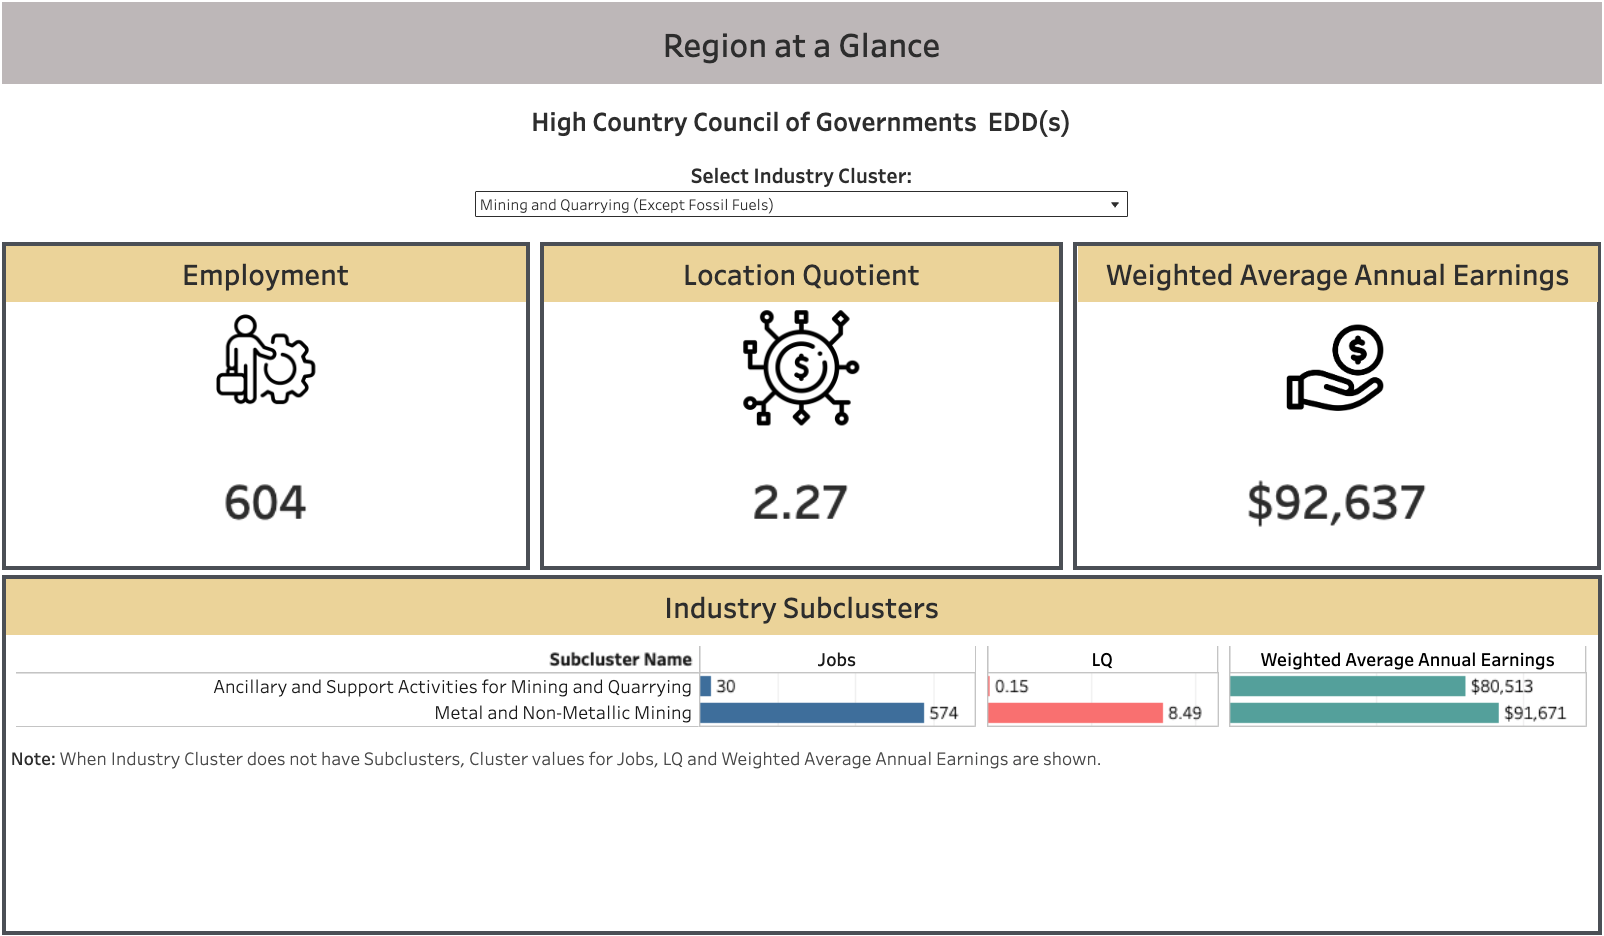
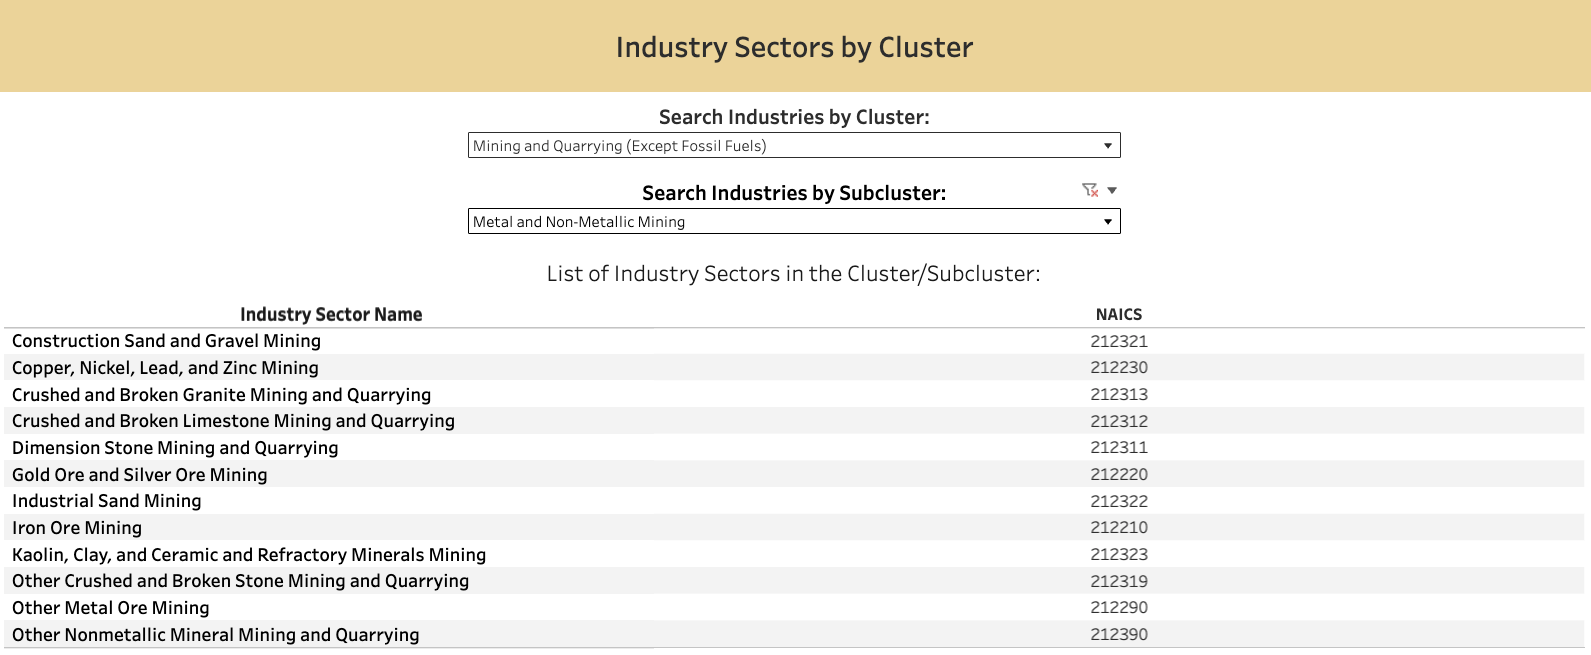
Drilling down into Mining and Quarrying (Except Fossil Fuels) reveals two subclusters: Ancillary and Support Activities for Mining and Quarrying, and Metal and Non-Metallic Mining. The latter stands out, with 574 jobs, an LQ of 8.49, and weighted average annual earnings of $91,671. Notably, both NAICS 212322 (Industrial Sand Mining) and NAICS 212321 (Construction Sand and Gravel Mining) fall within the Metal and Non-Metallic Mining subcluster. Industrial sand mining includes silica sand operations, which supply raw materials used in products such as glass, ceramics, and other industrial applications. To identify these connections, open the industry-based cluster definitions dashboard#footnote-88 available through RegionalClusters.com. Near the bottom of the dashboard, users can search for industry sector names to determine the cluster and subcluster to which that specific industry sector belongs. This feature helps illustrate how specific industry sectors, such as silica sand mining, relate to broader regional industry clusters.
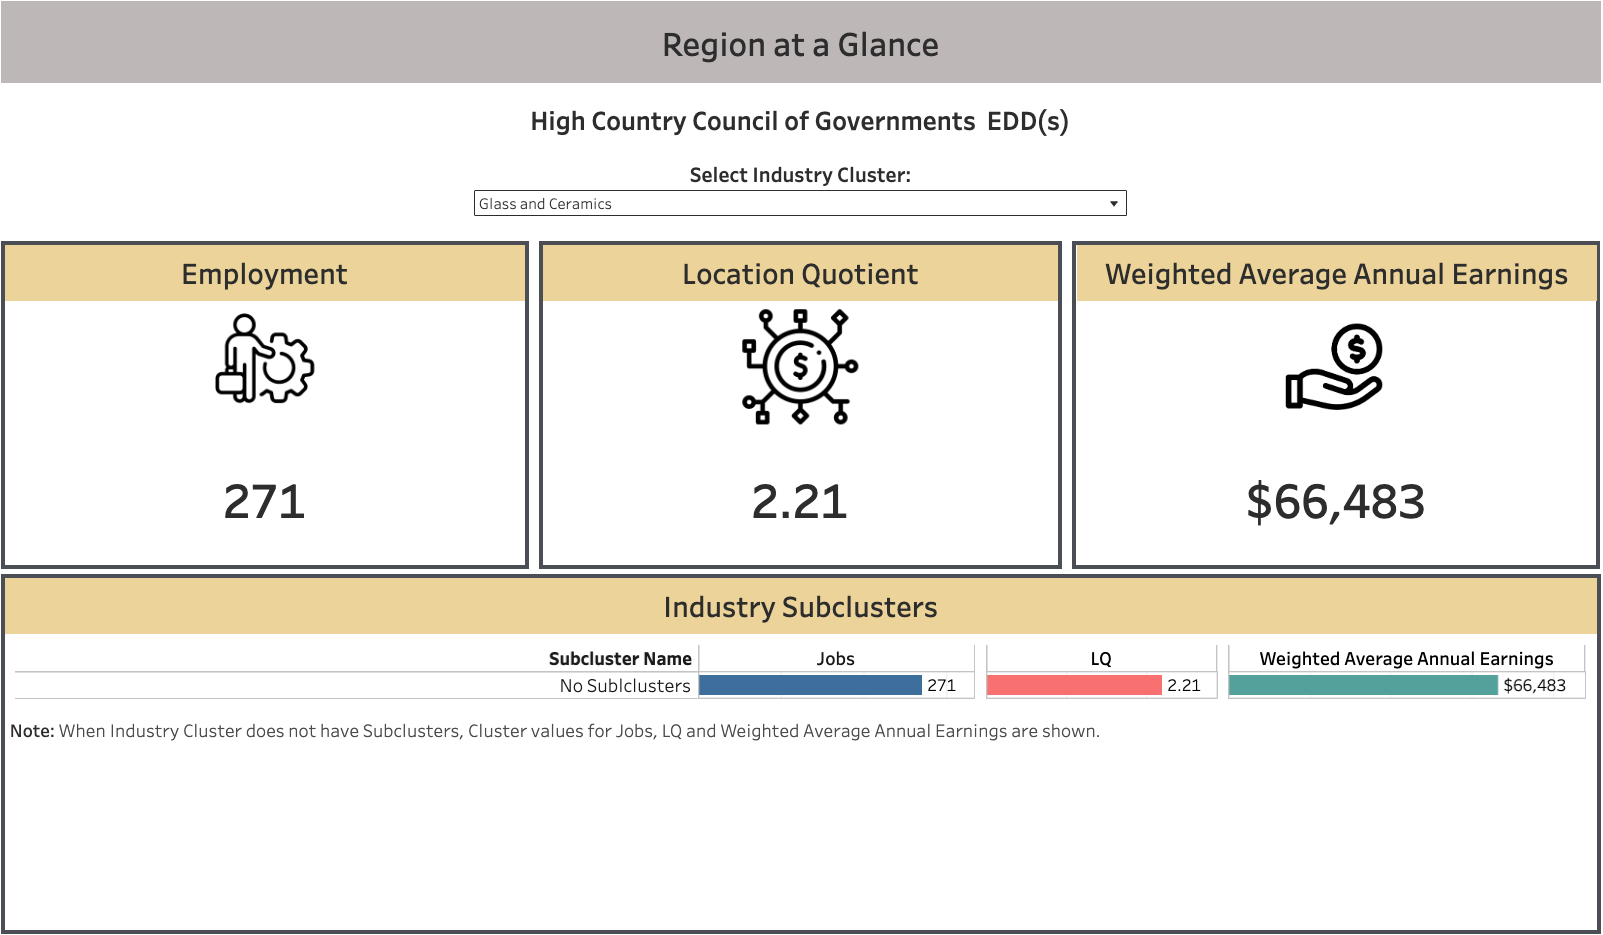
Further exploration reveals another industry cluster connected to the region’s mining economy: Glass and Ceramics. This cluster employs 271 workers, has a location quotient (LQ) of 2.20, and offers weighted average annual earnings of $66,483. Like Mining and Quarrying (Except Fossil Fuels), this cluster is also concentrated in the High Country region compared to the national average, indicating a regional specialization. Unlike Mining and Quarrying, the Glass and Ceramics cluster does not contain any subclusters.
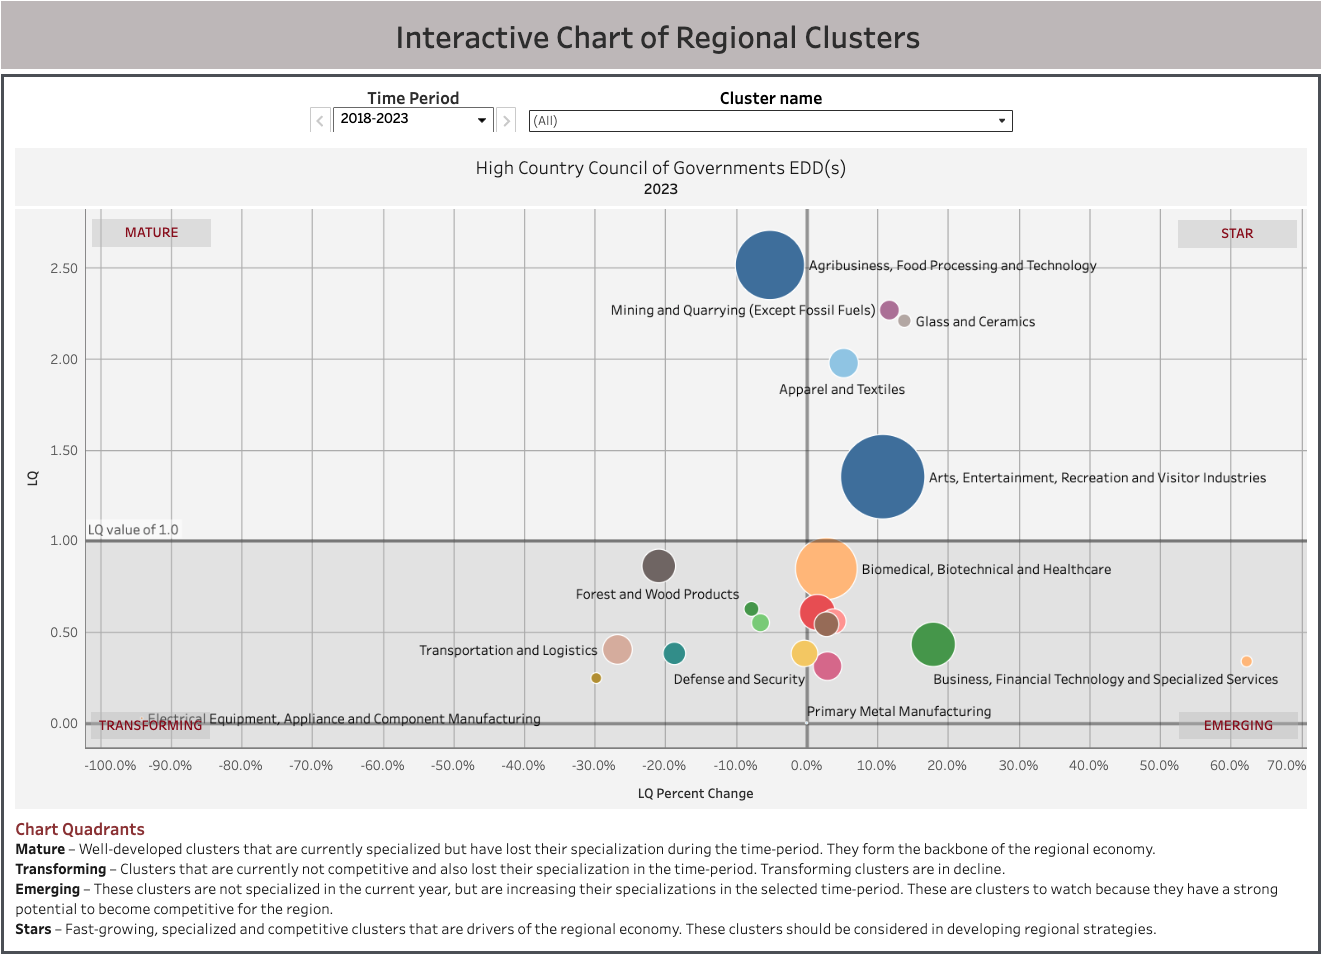
The presence of Spruce Pine mining establishments is visible through both mining and quarrying and glass and ceramics clusters in the STAR quadrant. Despite having a smaller number of jobs, both the clusters are not only specialized, but also grown their specialization during the 2018-2023 period.
The analysis shows how EDDs can explore their unique assets and interconnect with industry clusters in the region. The extensive global supply chain of semiconductors connects to a small community in North Carolina through its mining enterprises.
Footnotes
- https://www.census.gov/newsroom/blogs/random-samplings/2023/09/transforming-annual-surveys-businesses.html
- https://www.njmep.org/blog/chips-act-boosts-domestic-manufacturing/
- https://www.naics.com/naics-code-description/?code=333242&v=2022
- https://www.semi.org/en/news-media-press-releases/semi-press-releases/global-semiconductor-equipment-billings-slip-to-%24106.3-billion-in-2023-semi-reports
- https://edpnc.com/articles/why-north-carolina-is-emerging-as-a-top-destination-for-semiconductor-companies/
- https://edconway.substack.com/p/whats-happening-at-spruce-pine
- https://pcrd.purdue.edu/regionalclusters/
- https://pcrd.purdue.edu/regionalclusters/industry-clusters/definitions.php

Indraneel Kumar is the Director for the Purdue Center for Regional Development (PCRD). Indraneel has been at PCRD since its inception in 2005. He focuses... read more