A Detailed Look at Indiana’s Population Change Over the Past Two Decades

Written by Roberto Gallardo and Benjamin St. Germain.
To better understand population change, the U.S. Census keeps track of what it calls components of population change. These components include natural (difference between births and deaths), international (inflows and outflows to and from abroad), and domestic (movement within the state and the nation).
A recent Daily Yonder article found that nonmetropolitan counties of the nation lost population in the 2010-2020 decade (they gained population during the 2000-2010 decade) mostly due to domestic migration and a slowdown in both the natural increase and international (immigration).
Using this dataset, we look at Indiana counties over the past two decades (2000-2010 and 2010-2020) to get a better sense of how these areas are changing and why. Our focus will be urban (metropolitan), small city (micropolitan), and rural (noncore) counties using the United States Department of Agriculture 2013 Urban Influence Codes.
Note, however, that six counties were reclassified during these two decades (Franklin from urban to rural, Gibson from urban to rural, Greene from urban to rural, Scott from small city to urban, Tipton from urban to rural, and Union from rural to urban). Rather than removing these counties from the analysis, the latest classification (2013) was retroactively applied to the 2000-2010 decade. Key findings and trends remained the same.
Figure 1 shows the state gained close to 370,000 residents in the 2000-2010 decade decreasing to 272,000 in the 2010-2020 decade. Note that while the state gained net residents during both decades, the domestic component (gray) was negative and almost doubled from one decade to the next (25,000 in 2000-2010 to 47,000 in 2010-2020). Both the international (orange) and natural (blue) components increased in both decades though the natural increase was lower in the 2010-2020 compared to the previous decade.
Figure 1. Cumulative Components of Population Change for Indiana by Decade
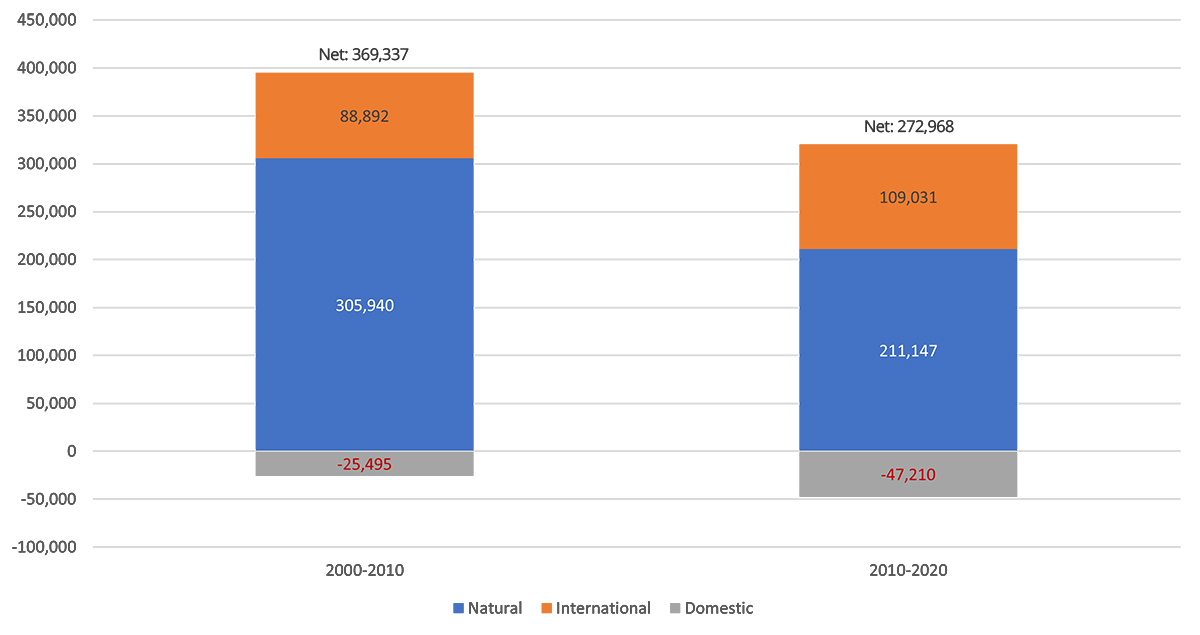
Source: U.S. Census; PCRD
On the other hand, Figure 2 shows cumulative components of population change for rural Indiana. Overall, rural Indiana lost roughly 3,000 residents during the 2000-2010 decade increasing to losing a little more than 9,000 in the 2010-2020 decade or three times as much. Natural component increased but was half compared to the 2000-2010 decade and international also increased, though at a slower pace (2,300 versus 1,500).
Figure 2. Cumulative Components of Population Change for Rural Indiana by Decade
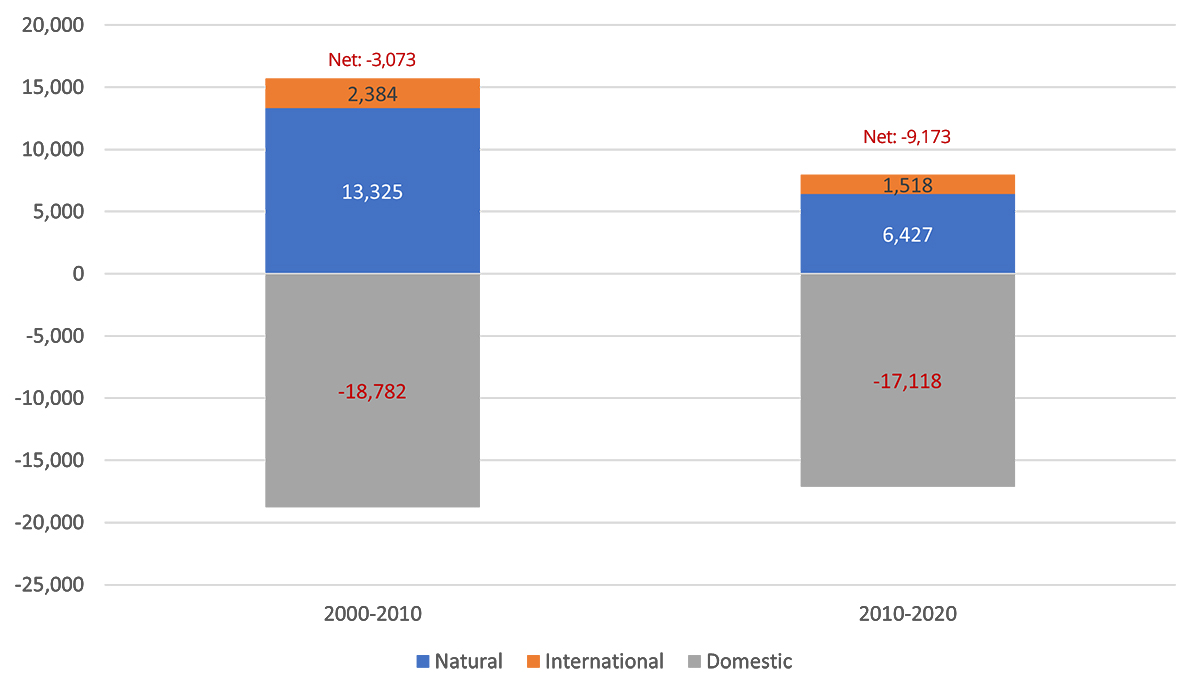
Source: U.S. Census; PCRD
The interactive maps below show the 2000-2010 decade on the top and the 2010-2020 on the bottom for Indiana counties. A darker color means (other than red) all three components of population change increased during that decade. Red counties indicate all three components of population change decreased. Click on a county to display the actual numbers for each of the components of population change.
In the 2000-2010 decade, 22 out of 92 counties had an increase in all three components (dark blue) compared to only 13 in the 2010-2020. On the other hand, 68 out of 92 counties lost residents due to domestic migration during the 2000-2010 decade compared to 72 out of 92 counties in the 2010-2020 decade. Lastly, a lighter color (light tan) indicates that those counties had an increase in only one of the three components. Notice an increase between decades.
Lastly, the interactive dashboard below shows the county data in a different way. You can select a specific county or group counties by type on the upper right. The total will show below the filters while a breakdown by county and component will show at the center. You can also sort the county table by ascending or descending order (clicking on the column title) using the table at the bottom right. To look at 2010-2020, click on the arrow on the bottom center of the screen.
By sorting in descending order based on population change, we see that Hamilton County had the highest population gain in 2000-2010 with 92,000 and again in the 2010-2020 decade with almost 70,000. On the other hand, Grant County had the highest population loss in the 2000-2010 decade with 4,300 while Lake County took this spot in the 2010-2020 decade with a loss of 8,500, followed by Grant County.
The fact that natural increase is slowing down is not unique to Indiana. The country is experiencing this slow down as well. The main challenge for rural Indiana is outmigration. Efforts need to be made to improve the quality of place—healthcare, schools, amenities— of rural communities and focus on business retention, entrepreneurship, and remote work to provide rural workers with decent paying jobs while investing in upskilling and reskilling. Making rural communities more welcoming to international or immigrant residents can also help buffer the loss experienced by outmigration.

Roberto Gallardo is the Vice President for Engagement and an Associate Professor in the Agricultural Economics Department. He holds an electronics engineering undergraduate degree, a... read more


