Remote Work Opportunities in Indiana: The Metro/Nonmetro Gap

Remote Work Opportunities in Indiana: The Metro/Nonmetro Gap1 – Written by Bo Beaulieu & Indraneel Kumar.
There is a growing sense of optimism that Indiana’s economy is well on its way to recovering from the devasting impacts of COVID 19 on Hoosier households, businesses and communities. A Back-to-Normal Index developed by Moody’s Analytics and CNN show that Indiana’s economy is operating at 96% of what it was in early March 2020.2 Indiana’s Back-to-Normal state rank is now 14 with 1 being the best and 50 the worst.3 This indicates that several businesses that were shuttered for months during the pandemic are now reopening and a growing number of companies are once again seeking workers to fill job openings. One important shift that occurred during the course of the pandemic was the expanding number of people who were able to carry out their job responsibilities remotely, especially from their homes. As noted in our previous blog (April 2021), the number of people working from home on a full-time or a periodic basis has swelled over the past 15 months. Now that industries and businesses are starting to return to a state of normalcy, one of the challenges these enterprises might face is whether employees who were given the flexibility to work from home over the past several months will be allowed to continue doing so.
In our April 2021 blog, we noted that the ability to work remotely is heavily dependent on the nature of the jobs, roles, and responsibilities held by individuals. Simply put, not all jobs can be performed from the home office, especially those that require face-to-face interactions and/or collaborations with co-workers and/or customers; necessitate the use of specialized machinery; or involve work in the retail trade, health care, transportation/delivery services, food/business services, or waste collection/management sectors.4 So, to assess what jobs in Indiana are most amenable to remote work, we drew on a 2020 study conducted by Jonathan Dingel and Brent Neiman with the University of Chicago’s Beck Friedman Institute for Economics. They studied the critical elements associated with nearly 1,000 occupations and were able to determine the feasibility of these jobs being done remotely. In addition, they linked these occupations to the U.S. Bureau of Labor’s six-digit Standard Occupational Classification (SOC) codes, a step that allowed them to determine the actual number of jobs that are remote-friendly within each of these SOC codes. They concluded that some 37 percent of U.S. jobs could be carried out on a remote basis.
By employing this same methodology, we concluded that 34.4 percent of the jobs in Indiana could be performed at home or on a remote basis, a figure that was slightly below the national percentage arrived at by Dingel and Neiman.5
In this second blog, we build on our April 2021 report by comparing the occupational make-up of jobs in the state’s metropolitan and nonmetropolitan areas. The key questions we wanted to address is the following: Are metro-based jobs more likely to be remote-friendly relative to their nonmetro counterparts? And if so, is the composition of the most and least remote compatible jobs similar or different in the state’s metro and nonmetro counties?6
Occupations Amenable to Remote Work in Indiana: A Metro/Nonmetro Comparison
Figure 1 reports the share of jobs in the state’s metropolitan and nonmetropolitan counties that are amenable to being performed remotely since 2001. What Figure 1 makes clear is that the proportion of jobs that are remote compatible has not expanded to any appreciable degree over the 2001-2019 time period. Specifically, remote-friendly jobs in metro areas of the state now stand at 35.9 percent (as of 2019, the latest date in which information is available), just 1.8 percentage points higher than in 2001. While 26.7 percent of the jobs in nonmetropolitan were deemed remote compatible in 2001, this number grew modestly to 28.2 percent by 2010, but then slipped to 27.5 percent by 2019.
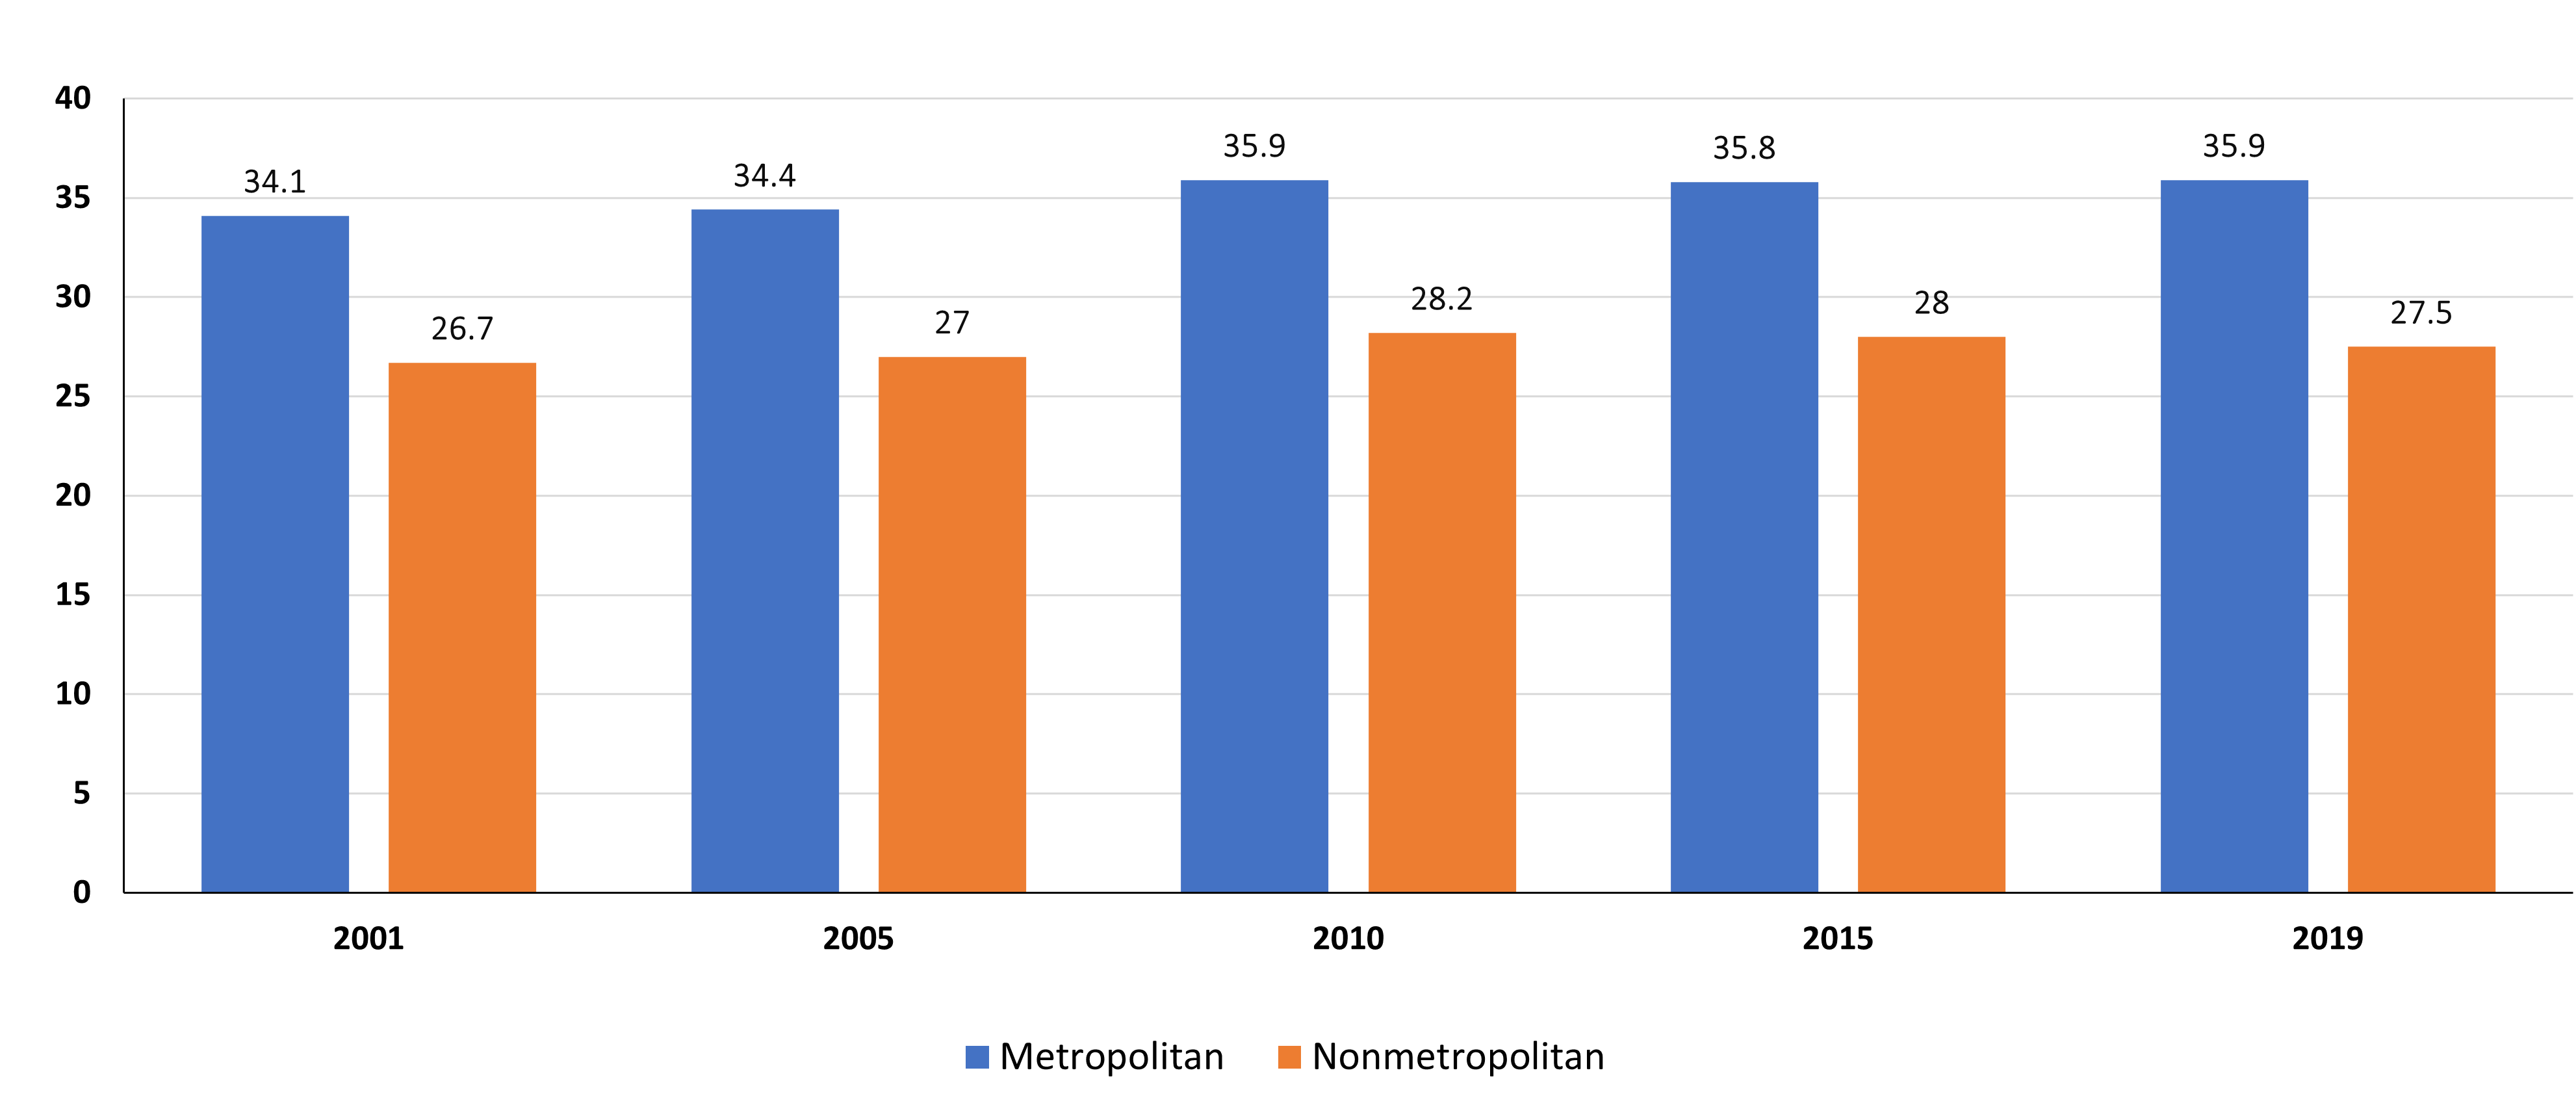
A second observation is that the gap in remote compatible jobs between metro and nonmetro areas of the state has been on the upswing over the past two decades. While the metro/nonmetro difference stood at 7.4 percentage points in 2001, it grew to 7.7 percent by 2010, 7.8 percent by 2015, and 8.4 percent by 2019. To help facilitate our assessment of why the metro/nonmetro gap in remote compatible jobs has been slowly increasing, we turn to a closer examination of the occupational make-up of jobs in these two distinct geographic categories (as of 2019). We do so by aggregating the 251 six-digit SOC codes into their relevant two-digit SOC groupings. In all, 21 of 23 two-digit (major group) SOC codes in Indiana have jobs that can be done remotely. The two remaining SOC major groups have no remote compatible occupations (“Building and Grounds Cleaning/Maintenance” and “Military Only” positions), and as such, are not included in our analysis.
The Most and Least Remote-Amenable Jobs by Metropolitan Status in Indiana
Table 1 showcases the two-digit Standard Occupational Classification (SOC) codes having at least two-thirds of their jobs that could be performed remotely.7 The left panel highlights the top remote compatible occupational groupings in metropolitan areas of Indiana, while the right panel focuses on the top remote compatible occupational categories found in nonmetro counties of the state.
With respect to metropolitan areas of Indiana, we find that nine major occupational categories have the largest share of remote amenable jobs. Collectively, they represent nearly 949,000 jobs, or over 81 percent of all remote compatible jobs existing in these metropolitan counties (as of 2019). Although the ranking of the occupational groupings may not be in total alignment, the SOC groupings in nonmetro counties are quite similar to those found in metro areas. In particular, eight occupational groupings have a high percentage of jobs that are remote-friendly in both the metro and nonmetro areas. The sole exception is “management” which fails to place in the top list of remote compatible jobs in nonmetro parts of the state. Less than 49 percent of nonmetro-based management jobs are amenable to remote work, 30 percentage points lower than management jobs existing in metro areas. Collectively, the eight most remote compatible occupational groups in nonmetro Indiana constitute just over 68 percent of the remote amenable jobs in nonmetro Indiana.
Table 1. The Most Remote Amenable Jobs in Indiana (2019) by Metropolitan Status
| Metropolitan Counties | Nonmetropolitan Counties | ||||||
|---|---|---|---|---|---|---|---|
| MOST AMENABLE | MOST AMENABLE | ||||||
| SOC | Occupational Grouping | No. | % | SOC | Occupational Grouping | No. | % |
| 15 | Computer & Mathematical | 66,667 | 100 | 15 | Computer & Mathematical | 6,519 | 100 |
| 25 | Education Instruction & Library | 161,551 | 98.6 | 25 | Education Instruction & Library | 3,5866 | 98.8 |
| 13 | Business & Financial Operations | 150,997 | 92.1 | 13 | Business & Financial Operations | 22,817 | 91 |
| 23 | Legal | 17,861 | 91.7 | 23 | Legal | 2,052 | 87.8 |
| 17 | Architecture & Engineering | 38,173 | 81 | 17 | Architecture & Engineering | 9,672 | 80.4 |
| 43 | Office & Administrative Support | 278,199 | 79.1 | 43 | Office & Administrative Support | 50,070 | 73.9 |
| 11 | Management | 168,788 | 78.8 | 27 | Arts, Design, Entertainment, Sports & Media | 10,003 | 71.8 |
| 27 | Arts, Design, Entertainment, Sports & Media | 64,760 | 72.4 | 19 | Life, Physical and Social Science | 2,278 | 68.8 |
| 19 | Life, Physical and Social Science | 19,376 | 70.2 | ||||
| Total | 948,932 | 81.2* | Total | 142,261 | 68.2** | ||
* Percent of all remote-compatible jobs in metro Indiana – ** Percent of all remote-compatible jobs in nonmetro Indiana
It is difficult for certain jobs to be done on a remote basis because of the contextual features of the work (such as the physical and social factors that shape the nature of the job) and the types of activities associated with the job (such as the level of interactions required with the public or the need to operate/repair important machinery).8 To help gain a better understanding of the types of jobs that are least likely to be carried out remotely, we compiled the information captured in Table 2.9
What we discovered is that nine occupational groupings in the state’s metro areas, and seven in its nonmetro counties, can be categorized as the least remote compatible. These include jobs in food preparation and serving, construction and extraction, installation/maintenance repair, production, health care support, transportation/moving, and protective services – in both metro and nonmetro areas of Indiana. Taken as a whole, the nine metro-based occupational groupings shown in Table 2 represent just a 3.1 percent share of the remote amenable jobs located in Indiana’s metro areas and only 1.9 percent of remote compatible jobs in nonmetro Indiana. Clearly, these jobs have specific attributes or responsibilities that simply make them impossible to be performed on a remote basis. Case in point are the food preparation and serving-related occupations that have only 44 jobs in metro areas and no jobs in nonmetro counties that are remote compatible, despite the fact that food preparation and related occupations represent over 242,000 job in metro areas and nearly 50,000 jobs in the nonmetro parts of Indiana as of 2019.
Table 2. The Least Remote Amenable Jobs in Indiana (2019) by Metropolitan Status
| Metropolitan Counties | Nonmetropolitan Counties | ||||||
|---|---|---|---|---|---|---|---|
| LEAST AMENABLE | LEAST AMENABLE | ||||||
| SOC | Occupational Grouping | No. | % | SOC | Occupational Grouping | No. | % |
| 35 | Food Preparation and Serving | 44 | 0 | 35 | Food Preparation and Serving | 0 | 0 |
| 47 | Construction and Extraction | 126 | 0.1 | 47 | Construction and Extraction | 35 | 0.1 |
| 49 | Installation, Maintenance & Repair | 1,076 | 0.8 | 51 | Production | 872 | 0.7 |
| 51 | Production | 2,596 | 0.9 | 49 | Installation, Maintenance & Repair | 283 | 0.9 |
| 31 | Healthcare Support | 3,430 | 3.1 | 31 | Healthcare Support | 413 | 1.9 |
| 53 | Transportation and Moving | 10,523 | 3.5 | 53 | Transportation and Moving | 2,048 | 2.9 |
| 45 | Farming, Fishing & Forestry | 432 | 4.3 | 33 | Protective Services | 326 | 0.034 |
| 33 | Protective Services | 2,548 | 4.6 | ||||
| 29 | Healthcare Practitioners & Technical | 15,434 | 8.5 | ||||
| Total | 36,209 | 3.1%* | Total | 3,977 | 1.9%** | ||
* Percent of all remote-compatible jobs in metro Indiana – ** Percent of all remote-compatible jobs in nonmetro Indiana
Remote Workers: A Unique Opportunity for Indiana’s Nonmetro Areas?
The acceleration in remote work associated with the onset of COVID-19 is not likely to return to pre-pandemic levels in the months ahead. A May 2021 article published by LinkedIn, for example, indicates that the proportion of paid job postings on LinkedIn offering a remote work option has grown by nearly 460 percent over the past year (from May 2020 to May 2021) relative to the share just one year earlier.10 Furthermore, surveys conducted by Upwork of 1,500 hiring managers reveal that these individuals project that nearly 40 percent of their workforce will be working remotely on a 50-100 percent basis within the next five years, a rate that is two-thirds higher that what was anticipated prior to the pandemic.11
Another emerging trend is the growing share of remote workers who anticipate moving from costly major cities to communities with more affordable housing options and lower population densities. According to a study conducted by Upwork of over 20,000 U.S. residents, increasing numbers of remote workers plan to move to places located anywhere from 2 to 4+ hours away from their current places of work.12 This finding is in alignment with the March 2021 article by Richard Florida and Adam Ozimek that states that the growing remote workforce is effectively decoupling the age-old connection between where people live and where they work.13
These key trends – the growing percentage of workers performing their jobs remotely, along with the increasing interest they have in migrating to smaller-sized, less costly communities – point to a golden opportunity for places in nonmetro Indiana. These nonmetro sites need to think seriously about how they can position themselves as great places for remote workers to live. In many respects, attracting remote workers to live, work and recreate in Indiana’s small cities and towns in nonmetro should become part of the economic development strategies being pursued by state and local leaders.
While not intended to be extensive, there are some important steps local leaders, economic development organizations, and state agencies should consider if they hope to make smaller communities viable places for attracting and retaining remote workers. They include the following:
- Build on the core occupational groupings that metro & nonmetro areas share in common: There are eight remote amenable occupational groupings noted in Table 1 that are prevalent in both metro and nonmetro areas of the state. As metro-based employers seek to expand the workforce associated with each of these groupings, it may be worthwhile for these key employers to explore the feasibility of hiring and training remote workers currently residing in nonmetro areas of Indiana. By taking such a step, metro-based employers could contribute to the expansion of good paying jobs for the nonmetro labor force, something that could help stem the outflow of talent from these rural places.
- Promote the digital assets of nonmetro-based communities: The State of Indiana has increased its investment in the expansion of high-quality broadband services to unserved and underserved areas of the state – many in rural areas of the state – in recent years. Having this asset in place is essential for any community that wishes to be competitive in attracting remote workers. For nonmetro-based Indiana communities that have made important strides in expanding its digital footprint, they should give serious consideration to developing and acting on a systematic plan that positions themselves as remote-friendly sites for employers and workers.
- Expand housing options for the remote workforce: One of the key factors that is prompting remote workers to leave large metro areas is the high cost of housing. As noted earlier, many are not averse to moving to smaller communities located over four hours away from their metro-based employers. But, having quality housing options is essential for communities that wish to be seen as hospitable places for remote workers. Certainly, this is no small challenge in light of the current housing shortage and unprecedented building materials shortage14 persisting in many parts of the state and nation. But if local officials can keep their eyes on the longer-term opportunities, then working to expand the mix of housing in their communities could pay dividends in attracting (and retaining) remote (and non-remote) workers.
- Market the varieties of local amenities: While lower costs for housing is one of the factors that is prompting more remote workers to ponder moves to less populated areas, there other features of smaller communities that could prove attractive. These include quality local schools, a good mix of parks and recreational opportunities, solid health care systems, vibrant downtowns, and a host of cultural activities. Showcasing the myriad of assets that smaller communities offer to remote workers would be time well spent.
- Develop a remote workforce pipeline: Given the projected growth of remote workers in the years ahead, nonmetro areas of Indiana should seriously consider building a pipeline of local residents who can work remotely or start their own businesses on a remote basis. With funding from the state legislature, for example, Utah launched the Rural Online Initiative (ROI) in 2018 for the expressed purpose of enhancing job opportunities in rural areas of the state.15 The program equips participants with the requisite skills to compete for remote work opportunities. To date, the program has successfully placed several participants into remote jobs. The exciting news is that the Purdue Center for Regional Development has adopted the Utah ROI program and is actively delivering the online program to interested Hoosiers. For more information, see: pcrd.purdue.edu/remoteworkcertificate/.
In closing, a recent article published by Brookings16 argues that the out-migration of remote workers from coastal superstar cities is unlikely to produce a significant influx of such migrants to states located in the Midwest region of the United States. While such findings could dampen plans by some Indiana’s nonmetro communities to pursue strategies designed to attract remote workers, it is important that local leaders remain focused on the long-term. The growing investment by federal and state leaders in digital equity and inclusion means that a number of social and economic opportunities could be forthcoming for many nonmetro-based Indiana communities. Communities that produce and enact a sound plan for building on these digital investments are more likely to achieve some success attracting and retaining remote workers as a key part of their comprehensive economic and workforce development strategy.
A.1. Number of Remote-Amenable Occupations (Jobs) in Metro Indiana by Two-Digit SOC Codes
| SOC-2 | Occupations | 2001 | 2005 | 2010 | 2015 | 2019 |
|---|---|---|---|---|---|---|
| 11 | Management | 106,604 | 114,410 | 122,316 | 154,948 | 168,788 |
| 13 | Business and Financial Operations | 94,608 | 101,237 | 117,265 | 133,085 | 150,997 |
| 15 | Computer and Mathematical | 41,826 | 43,593 | 50,447 | 58,417 | 66,667 |
| 17 | Architecture and Engineering | 32,038 | 32,524 | 32,105 | 34,053 | 38,173 |
| 19 | Life, Physical, and Social Science | 13,817 | 14,896 | 17,185 | 17,502 | 19,376 |
| 21 | Community and Social Service | 19,117 | 21,336 | 21,667 | 21,985 | 25,498 |
| 23 | Legal | 13,399 | 14,677 | 15,501 | 16,347 | 17,861 |
| 25 | Educational Instruction and Library | 134,277 | 145,222 | 151,792 | 154,507 | 161,551 |
| 27 | Arts, Design, Entertainment, Sports, and Media | 44,415 | 48,534 | 52,346 | 58,377 | 64,760 |
| 29 | Healthcare Practitioners and Technical | 12,594 | 13,770 | 12,383 | 13,843 | 15,434 |
| 31 | Healthcare Support | 4,239 | 4,175 | 3,940 | 3,236 | 3,430 |
| 33 | Protective Service | 2,101 | 2,116 | 2,423 | 2,531 | 2,548 |
| 35 | Food Preparation and Serving Related | 46 | 52 | 50 | 43 | 44 |
| 39 | Personal Care and Service | 44,843 | 42,240 | 44,794 | 41,997 | 39,243 |
| 41 | Sales and Related | 91,794 | 90,185 | 93,519 | 96,648 | 100,696 |
| 43 | Office and Administrative Support | 300,721 | 292,876 | 268,595 | 278,112 | 278,199 |
| 45 | Farming, Fishing, and Forestry | 515 | 471 | 458 | 470 | 432 |
| 47 | Construction and Extraction | 134 | 138 | 99 | 141 | 126 |
| 49 | Installation, Maintenance, and Repair | 1,414 | 1,226 | 1,062 | 1,093 | 1,076 |
| 51 | Production | 3,595 | 3,235 | 2,873 | 2,638 | 2,596 |
| 53 | Transportation and Material Moving | 10,147 | 9,863 | 9,169 | 9,545 | 10,523 |
| Grand Total | 972,243 | 996,774 | 1,019,988 | 1,099,520 | 1,168,019 |
A.2. Percent of Remote-Amenable Occupations (Jobs) in Metro Indiana by Two-Digit SOC Codes
| SOC-2 | Occupations | 2001 | 2005 | 2010 | 2015 | 2019 |
|---|---|---|---|---|---|---|
| 11 | Management | 67.4% | 70.3% | 72.3% | 78.3% | 78.8% |
| 13 | Business and Financial Operations | 89.8% | 90% | 91.6% | 91.7% | 92.1% |
| 15 | Computer and Mathematical | 100% | 100% | 100% | 100% | 100% |
| 17 | Architecture and Engineering | 77.9% | 78.8% | 79.5% | 80.1% | 81% |
| 19 | Life, Physical, and Social Science | 67.4% | 66.5% | 69.5% | 67.6% | 70.2% |
| 21 | Community and Social Service | 52.8% | 53.9% | 53.2% | 47.8% | 48.7% |
| 23 | Legal | 90.8% | 91.2% | 90.5% | 90.4% | 91.7% |
| 25 | Educational Instruction and Library | 98.7% | 98.6% | 98.9% | 98.8% | 98.6% |
| 27 | Arts, Design, Entertainment, Sports, and Media | 72.8% | 73.7% | 73.4% | 75.3% | 72.4% |
| 29 | Healthcare Practitioners and Technical | 9.8% | 9.8% | 7.9% | 8.4% | 8.5% |
| 31 | Healthcare Support | 6.5% | 5.6% | 4.3% | 3.1% | 3.1% |
| 33 | Protective Service | 4.2% | 4.2% | 4.8% | 4.7% | 4.6% |
| 35 | Food Preparation and Serving Related | 0% | 0% | 0% | 0% | 0% |
| 39 | Personal Care and Service | 51% | 47.3% | 45.1% | 42% | 37.6% |
| 41 | Sales and Related | 25.5% | 24.5% | 26.2% | 25.9% | 26.6% |
| 43 | Office and Administrative Support | 77.4% | 77.6% | 77.9% | 78.5% | 79.1% |
| 45 | Farming, Fishing, and Forestry | 5.4% | 5.9% | 5.5% | 4.8% | 4.3% |
| 47 | Construction and Extraction | 0.1% | 0.1% | 0.1% | 0.1% | 0.1% |
| 49 | Installation, Maintenance, and Repair | 1.2% | 1% | 1% | 0.9% | 0.8% |
| 51 | Production | 1.3% | 1.2% | 1.2% | 1% | 0.9% |
| 53 | Transportation and Material Moving | 3.9% | 3.8% | 3.9% | 3.6% | 3.5% |
| Grand Total | 34.1% | 34.4% | 35.9% | 35.8% | 35.9% |
A.3. Number of Remote-Amenable Occupations (Jobs) in Nonmetro Indiana by Two-Digit SOC Codes
| SOC-2 | Occupations | 2001 | 2005 | 2010 | 2015 | 2019 |
|---|---|---|---|---|---|---|
| 11 | Management | 23,635 | 24,414 | 26,088 | 32,001 | 30,645 |
| 13 | Business and Financial Operations | 17,183 | 17,679 | 19,112 | 21,308 | 22,817 |
| 15 | Computer and Mathematical | 5,198 | 5,005 | 5,267 | 5,744 | 6,519 |
| 17 | Architecture and Engineering | 8,196 | 7,933 | 7,979 | 8,706 | 9,672 |
| 19 | Life, Physical, and Social Science | 1,961 | 1,979 | 2,268 | 2,347 | 2,278 |
| 21 | Community and Social Service | 4,416 | 4,918 | 5,157 | 5,281 | 5,466 |
| 23 | Legal | 1,781 | 1,856 | 1,780 | 1,939 | 2,052 |
| 25 | Educational Instruction and Library | 34,330 | 34,849 | 35,046 | 36,052 | 35,850 |
| 27 | Arts, Design, Entertainment, Sports, and Media | 9,027 | 9,377 | 9,309 | 9,712 | 10,003 |
| 29 | Healthcare Practitioners and Technical | 2,072 | 2,137 | 1,923 | 2,126 | 2,256 |
| 31 | Healthcare Support | 667 | 629 | 679 | 484 | 413 |
| 33 | Protective Service | 407 | 433 | 396 | 287 | 326 |
| 35 | Food Preparation and Serving Related | 11 | 0 | 0 | 0 | 0 |
| 39 | Personal Care and Service | 11,658 | 9,999 | 10,205 | 9,205 | 8,751 |
| 41 | Sales and Related | 17,280 | 18,000 | 17,411 | 17,244 | 17,833 |
| 43 | Office and Administrative Support | 60,851 | 58,467 | 51,272 | 52,322 | 50,070 |
| 45 | Farming, Fishing, and Forestry | 385 | 355 | 391 | 417 | 415 |
| 47 | Construction and Extraction | 52 | 52 | 23 | 29 | 35 |
| 49 | Installation, Maintenance, and Repair | 358 | 344 | 248 | 250 | 283 |
| 51 | Production | 1,414 | 1,287 | 1,235 | 1,052 | 872 |
| 53 | Transportation and Material Moving | 2,582 | 2,510 | 2,104 | 1,866 | 2,048 |
| Grand Total | 203,464 | 202,225 | 197,893 | 208,373 | 208,604 |
A.4. Percent of Remote-Amenable Occupations (Jobs) in Nonmetro Indiana by Two-Digit SOC Codes
| SOC-2 | Occupations | 2001 | 2005 | 2010 | 2015 | 2019 |
|---|---|---|---|---|---|---|
| 11 | Management | 36% | 40.4% | 41.5% | 49.2% | 48.5% |
| 13 | Business and Financial Operations | 88.1% | 88.1% | 90.2% | 90.4% | 91% |
| 15 | Computer and Mathematical | 100% | 100% | 100% | 100% | 100% |
| 17 | Architecture and Engineering | 70.5% | 71.9% | 74.5% | 77% | 80.4% |
| 19 | Life, Physical, and Social Science | 69.2% | 68.2% | 71.8% | 67.5% | 68.8% |
| 21 | Community and Social Service | 54.2% | 54.8% | 55.6% | 52.3% | 49.2% |
| 23 | Legal | 85.4% | 85.4% | 83.8% | 85.8% | 87.8% |
| 25 | Educational Instruction and Library | 99.3% | 99.2% | 99.1% | 99.3% | 98.8% |
| 27 | Arts, Design, Entertainment, Sports, and Media | 74% | 74.7% | 73.2% | 73.8% | 71.8% |
| 29 | Healthcare Practitioners and Technical | 8.5% | 8.1% | 7.1% | 7.7% | 8% |
| 31 | Healthcare Support | 4% | 3.4% | 3.2% | 2.2% | 1.9% |
| 33 | Protective Service | 4.4% | 4.6% | 4.2% | 3% | 3.4% |
| 35 | Food Preparation and Serving Related | 0% | 0% | 0% | 0% | 0% |
| 39 | Personal Care and Service | 49.1% | 43.8% | 43.1% | 38.6% | 35.6% |
| 41 | Sales and Related | 21.1% | 21.7% | 22.7% | 21.9% | 22.5% |
| 43 | Office and Administrative Support | 75.1% | 75.5% | 74.8% | 75% | 73.9% |
| 45 | Farming, Fishing, and Forestry | 4.9% | 5.1% | 4.8% | 4.1% | 4% |
| 47 | Construction and Extraction | 0.1% | 0.1% | 0.1% | 0.1% | 0.1% |
| 49 | Installation, Maintenance, and Repair | 1% | 1% | 0.8% | 0.8% | 0.9% |
| 51 | Production | 1.1% | 1% | 1.2% | 0.9% | 0.7% |
| 53 | Transportation and Material Moving | 3.6% | 3.6% | 3.3% | 2.8% | 2.9% |
| Grand Total | 26.7% | 27% | 28.2% | 28% | 27.5% |
Footnotes
- This work was funded by as part of the CARES Act Supplemental funding provided by the Economic Development Administration, Grant No. ED20CHI3070054.
- See https://www.cnn.com/business/us-economic-recovery-coronavirus
- The methodology for Back-to-Normal Index is available from Moody’s Analytics here, https://www.moodysanalytics.com/-/media/whitepaper/2020/back-to-normal-Index-methodology
- Sources include: Nicholas Bloom, “How working from home works out.” Stanford Institute for Economic Policy Research; June 2020. Jonathan Dingel and Brent Neiman, “How many jobs can be done at home?” Becker Friedman Institute, University of Chicago; June 2020. Susan Lund, Anu Madgavkar, James Manyika, and Sven Smit. “What’s new for remote work: An analysis of 2,000 tasks, 800 jobs, and nine countries.” McKinsey Global Institute; November 2020; Drew Repp. “How communities can attract and retain remote workers.” Emsi; March 30, 2020. Kate Lister, “Work at home after COVID 19: Our forecast.” Global Workplace Analytics; Not Dated.
- We limited our analysis to the 209 five-digit SOC codes that Dingel and Neiman state can be done at home or remotely.
- We employ the 2013 metropolitan/nonmetropolitan definition as developed by the federal Office of Management and Budget. See https://www.ers.usda.gov/topics/rural-economy-population/rural-classifications/what-is-rural/ for more information on this and other geographic typologies.
- The cutoff point for delineating an SOC code as “most remote amenable” was 68%. This was due to the fact that the SOC code with next highest proportion of jobs that could be done remotely dropped to approximately 49% in both metro and nonmetro areas. As such, 68% appeared to be a logical cutoff point for our analysis. See tables A.1 and A.2. in the Appendix for more detailed information.
- Jonathan Dingel and Brent Neiman, “How many jobs can be done at home?” Becker Friedman Institute, University of Chicago; June 2020.
- The cutoff for an SOC code defined as “least remote amenable” were those with 8% or less of its workers being able to perform their jobs remotely. The selection of 8% or less made sense given that the next lowest remote amenable SOC code swelled to 35.6%. See tables A.3. and A.4. in the Appendix for more detailed information.
- George Anders, “Employers catch on: Remote work posts rise 457% as tech, media lead the way.” LinkedIn, May 26, 2021.
- Adam Ozimek, “The future of remote work.” Upwork, May 22, 2020.
- Adam Ozimek, “Remote Workers on the Move.” Upwork, October 29, 2020.
- Richard Florida and Adam Ozimek, “How remote work is reshaping America’s urban geography.” Wall Street Journal, March 5, 2021.
- Record Number of Builders Report Material Shortages, National Association of Home Builders, https://nahbnow.com/2021/06/record-number-of-builders-report-material-shortages. NAHB Now, June 2, 2021.
- See the following for information on the success of the Utah Rural Online Initiative. https://www.utahscanyoncountry.com/usu-roi-awards.
- Mark Muro, Yank You, Robert Maxim and Max Niles, “Remote work won’t save the heartland.” Brookings, June 23, 2021.

Dr. Bo Beaulieu is Professor Emeritus of Rural and Regional Development, Purdue Center for Regional Development and the Department of Agricultural Economics. Bo has played a... read more