The Rural Urban Continuum Code: What Changed?

The United States Department of Agriculture (USDA) Economic Research Service (ERS) has been compiling a rural urban continuum code (RUCC) every ten years since 1983. This continuum distinguishes metropolitan and nonmetropolitan counties by their population size, degree of urbanization, and adjacency to a metro area.
The criteria used to define metro areas have changed over time, affecting the comparability of the continuum. For example, the threshold for urban areas increased from 2,500 to 5,000 people in the 2023 version. However, it is still an interesting exercise to see how these changes affect the number of counties considered metropolitan or nonmetropolitan as well as their population.
The RUCC classifies counties in 9 types:
| Description | Code |
|---|---|
| Metropolitan area with a population of 1 million or more | 1 |
| Metropolitan area with a population between 250,000 and 1 million | 2 |
| Metropolitan area with a population of less than 250,000 | 3 |
| Urban population of 20,000 or more, adjacent to a metropolitan area | 4 |
| Urban population of 20,000 or more, not adjacent to a metropolitan area | 5 |
| Urban population between 5,000 and 20,000, adjacent to a metropolitan area | 6 |
| Urban population between 5,000 and 20,000, not adjacent to a metropolitan area | 7 |
| Urban population of less than 5,000, adjacent to a metropolitan area | 8 |
| Urban population of less than 5,000, not adjacent to a metropolitan area | 9 |
So, how does the 2022 population breakdown by RUCC codes in the U.S. and Indiana look like?
Using the 2023 RUCC and 2022 population estimates, we find that more than 85% of the U.S. population resided in counties considered metropolitan (codes 1-3) and close to 57% in counties with metropolitan areas with a population of one million or more. In Indiana, slightly more than 78% of the population resided in these metropolitan counties (codes 1-3) and close to 47% in metropolitan counties with a population of one million or more.
Looking at the six nonmetropolitan county types (codes 4-9), counties with an urban population of 20,000 or more adjacent to a metropolitan county (code 4) had the highest share with 4%. In Indiana, counties with an urban population between 5,000 and 20,000 adjacent to a metro county (code 6) had the highest share with 11.1%.
A total of 22 counties in Indiana were designated as a metropolitan area in Indiana ranging from Marion County (where Indianapolis is located) with a population of 969,000 to Ohio County with a population of 6,000. This may seem counterintuitive, that such a small population-wise county is considered metropolitan, but it is a limitation of any typology. Keep in mind that Ohio County is adjacent to the Cincinnati metropolitan area, Ohio, which had a 2020 population of 2.25 million.
| Code | Percent 2022 Population | U.S. | Indiana |
|---|---|---|---|
| 1 | Metro of 1m+ | 56.8 | 46.8 |
| 2 | Metro between 250k-1m | 20.5 | 14.6 |
| 3 | Metro <250k | 8.9 | 16.9 |
| 4 | Urban pop. 20,000+, adj. to metro | 4.0 | 4.0 |
| 5 | Urban pop. 20,000+, not adj. to metro | 1.3 | 1.6 |
| 6 | Urban pop. 5,000-20,000, adj. to metro | 3.5 | 11.1 |
| 7 | Urban pop. 5,000-20,000, not adj. metro | 1.8 | 2.1 |
| 8 | Urban pop. <5,000, adj. to metro | 1.9 | 2.8 |
| 9 | Urban pop. <5,000, not adj. to metro | 1.4 | 0.1 |
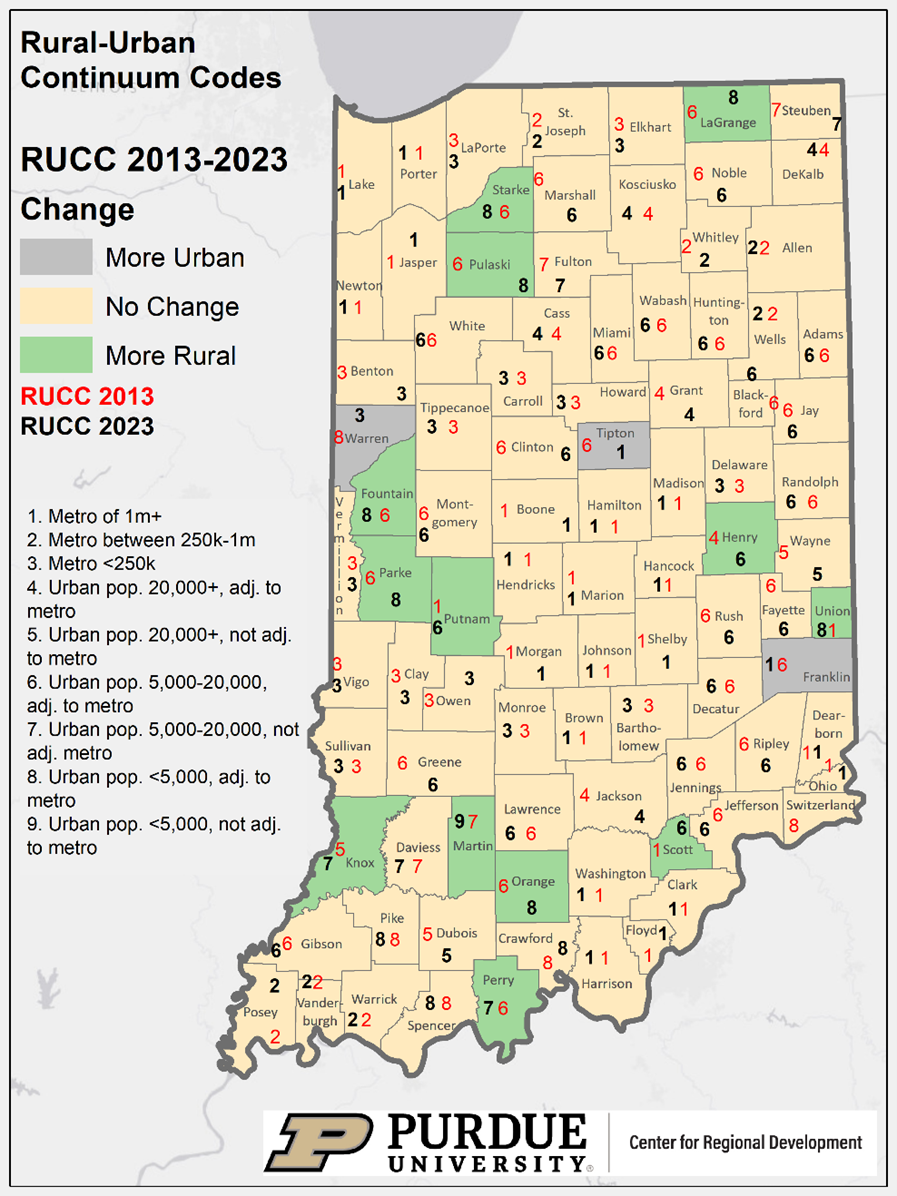
Next, we look at the change in RUCC codes of Indiana counties. The map below shows that most counties were not affected (tan color). However, 16 counties were affected. Three of these counties became more “urban” (gray color) or their RUCC code decreased while 13 counties became more “rural” (green color) or their RUCC code increased. In the 2023 RUCC, Martin County became the only county in the state to have an urban population of less than 5,000 and not adjacent to a metropolitan county, or a code 9. Martin County is also home to Crane Naval Research Facility and has a significant concentration of higher educated professionals.
When it comes to population, the table below shows the percent change based on 2022 population estimates between the 2013 and the 2023 RUCC codes for the country and the state. The biggest “winner” was code 8, or counties with an urban population of less than 5,000 adjacent to a metropolitan county. Their 2022 population increased on average 200% in the country and the state.
When it comes to a decrease, counties with an urban population of between 5,000 and 20,000 not adjacent to a metropolitan county experienced the largest decrease (25%) in the country. In Indiana, it was counties with an urban population of 20,000 or more not adjacent to a metropolitan county that experienced the largest decrease. Note that in Indiana, there were no counties with a code 9 in 2013, and therefore the percentage population change could not be calculated.
In other words, the nonmetropolitan population share in the U.S. decreased 1.6% on average compared to -0.1 percent in Indiana. On the other hand, the nonmetropolitan 2022 population share increased on average 34.7% in the U.S. and 41.2% in Indiana. This obviously is affected by the change in criteria for urban population in the 2023 RUCC (went from 2,500 to 5,000 population).
| Code | Percent Change 2022 Population, 2013 Vs. 2023 RUCC | U.S. | Indiana |
|---|---|---|---|
| 1 | Metro of 1m+ | 2.3 | -0.9 |
| 2 | Metro between 250k-1m | -5.0 | 0.0 |
| 3 | Metro <250k | -1.9 | 0.7 |
| 4 | Urban pop. 20,000+, adj. to metro | -1.8 | -15.1 |
| 5 | Urban pop. 20,000+, not adj. to metro | -17.9 | -24.6 |
| 6 | Urban pop. 5,000-20,000, adj. to metro | -20.8 | -9.1 |
| 7 | Urban pop. 5,000-20,000, not adj. metro | -25.4 | 46.0 |
| 8 | Urban pop. <5,000, adj. to metro | 193.4 | 208.8 |
| 9 | Urban pop. <5,000, not adj. to metro | 80.6 | --- |
There are many ways to define if a county or location is rural. The RUCC is only one of these ways. The Center analyzed another way to define rural at a more granular level (Census blocks versus counties). The objective of this analysis is to inform our partners and collaborators on the changes and impact of the RUCC, specifically. By no means is it implied that the RUCC will be the only rural definition used moving forward.

Roberto Gallardo is the Vice President for Engagement and an Associate Professor in the Agricultural Economics Department. He holds an electronics engineering undergraduate degree, a... read more


