Exploring Indiana: New Maps, Fresh Insights

Rural Indiana Stats (RIS) is always working to make information more accessible and insightful. We’re excited to introduce two new interactive maps in the Geographic Classification section that shed light on Indiana’s economic landscape.
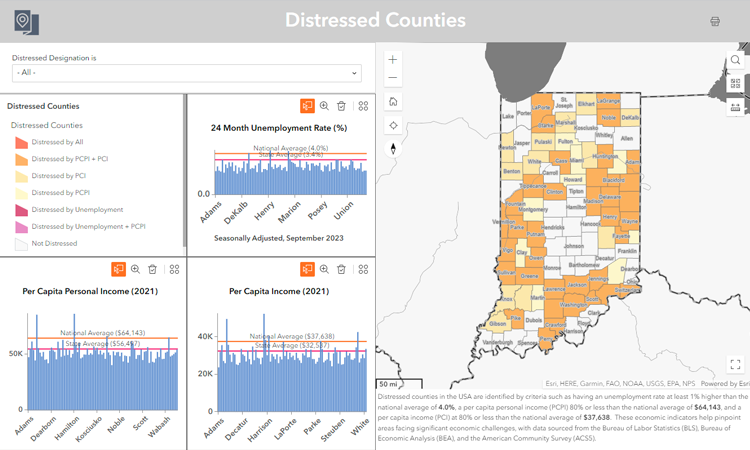
The first map, “Distressed Counties”, pulls data from trusted sources like the Bureau of Economic Analysis (BEA), Bureau of Labor Statistics (BLS), and the American Community Survey (ACS). Dive into the details of all ninety-two Hoosier counties, divided into distressed or non-distressed categories. Going a step further, breaking down distressed counties based on factors like unemployment, per capita personal income (PCPI), and per capita income (PCI). Counties earn the distressed label if they fall below specific thresholds, such as an unemployment rate at least 1% higher than the national average and PCI and PCPI at 80% or less than the national average.
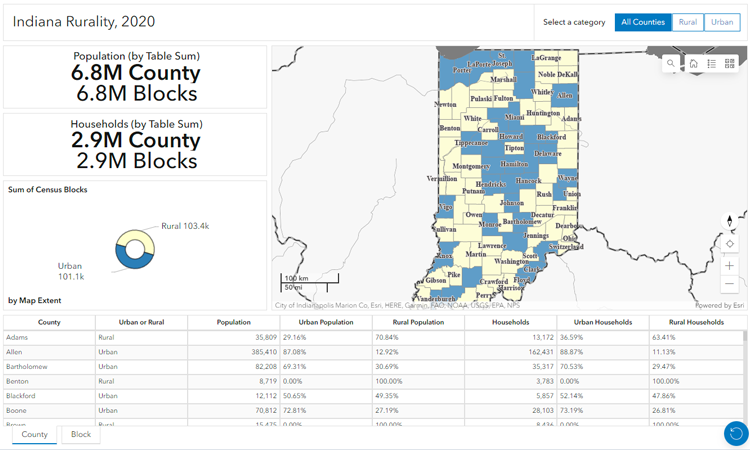
The second map, “2020 Urban and Rural by Census Blocks”, zooms in on Indiana at the census block level, classifying each as rural or urban. This distinction matters for decision-makers and researchers, influencing how federal funds are allocated based on population size in these areas. Dr. Indraneel Kumar explores this further in his June 2023 article.
As we continue to enhance RIS, watch out for the annual website update in winter 2024. And there’s something big on the horizon—RIS 2.0 is in the works, shaped by valuable user feedback. Haven’t shared your thoughts yet? You can still take the survey! Your input will help us make RIS even better.
Thanks for being a part of Rural Indiana Stats!

Benjamin St. Germain is a GIS Analyst for the Purdue Center for Regional Development, joining the staff in 2015. Benjamin uses a variety of data... read more


