Industry Clusters and Spatial Machine Learning Methods

Written by Ben St. Germain, Bertin Mbongo, Andrey Zhalnin, and Indraneel Kumar.
Industry clusters are a group of firms and business establishments that buy from and/or sell to each other. They can use similar technologies and share similar skilled labor force/workers. They are also connected via supply chains and compete with each other for the same markets and resources. Businesses in industry clusters develop, promote, and leverage innovation. Industry cluster establishments may require similar types of specialized infrastructure, services, and policy support from government. Overall, an industry cluster may have high, medium and low-skill jobs. Generally, clusters drive the economic growth in a region by exporting goods and services to markets out of the region. Industry clusters are economic clusters or engines of economic growth for a region. Industry or economic clusters are a way to explore regional economic competitiveness. Rooted in value chains, it is a framework that can help implement the saying, “Think Globally Act Regionally.”
While economic linkages listed above are important, businesses within industry clusters gain agglomeration benefits from geographic proximity to each other. A group of businesses closely located geographically can garner benefits of the economies of scale where they can attract suppliers and compete for talent, and in turn drive the wages upward. In this article, we are interested in exploring spatial proximity or geographic clustering of businesses. We are doing that by selecting business establishments within the same type of industries, geocoding the establishments, and running different types of clustering algorithms using Geographical Information Systems (GIS).
We are specifically exploring machine learning algorithms in spatial context. Machine learning is a family of methods within the broad area of data science. Generally, machine learning methods are of three types:
- Supervised learning,
- Unsupervised learning, and
- Reinforcement learning.
A crude example is as follows; supervised learning is when students learn a subject from the syllabus. Unsupervised learning is when the students learn a subject without syllabus. Reinforced learning is when students learn with or without syllabus, but eventually develop a better syllabus.
Supervised learning methods are based on training and testing datasets. Within GIS and remote sensing, land cover classification by the National Land Cover Database (NLCD) is an example of supervised learning. On the other hand, unsupervised learning methods work directly on the data and do not need prior training on test datasets. Reinforcement learning algorithms can steadily improve after failing and keep on improving with each successive run. Machine learning algorithms can be either of the three types.
Spatial machine learning is a set of algorithms where space or geographic location is included as one of the characteristics of the data. This is a rapidly emerging field within the GIS and spatial analysis. and Esri (Environmental Systems Research Institute) is a pioneer in developing spatial machine learning-based tools. Currently, the machine learning-based tools have been developed for classification, clustering as well as predictions. We will be focusing on the clustering-based spatial machine learning method. The objective is to explore application of these tools on business establishments and derive clusters based on similarities of characteristics or locations. We will be exploring density-based clustering methods such as Density-Based Spatial Clustering of Applications with Noise or DBSCAN (defined distance-based) and HDBSCAN (self-adjusting distance). A detailed exposition of density-based clustering is as follows.
Density-based clustering in ArcGIS Pro is an unsupervised learning method used to identify clusters of data points based on their spatial density rather than on predefined shapes or distances. The key idea behind density-based clustering is that a cluster in a space is a contiguous region of high point-density, separated from other clusters by contiguous regions of low point-density. This method, exemplified by algorithms like DBSCAN enables users to uncover clusters of varying shapes and sizes within spatial datasets. By analyzing the density of points within a specified radius, ArcGIS Pro can distinguish between core points, which have a high density of closely-located points, and noise points, which have low densities and are considered as outliers. This approach is particularly useful in application where clusters may have irregular shapes or varying densities, such as various types of industries in the U.S. Midwest states.
One of the key advantages of density-based clustering in ArcGIS Pro is its ability to automatically detect clusters of varying shapes and sizes without requiring prior knowledge of the number of clusters or their geometries. This flexibility makes it well-suited for analyzing spatial datasets with complex patterns and distributions. Moreover, density-based clustering is robust to noise and can effectively handle datasets with outliers or irregularly shaped clusters. With the use of ArcGIS Pro’s geospatial analysis tools, users can easily apply density-based clustering algorithms to their datasets, gaining valuable insights into spatial patterns and relationships for informed decision-making and resource allocation.
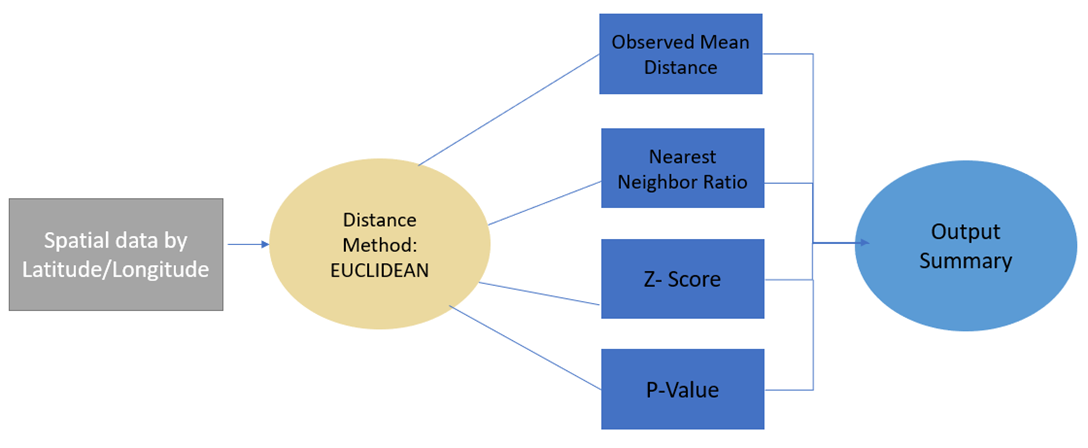
With the context of economic clusters, spatial machine learning methods can be applied. Using these methods and concepts certain insights were ascertained and are described below. The transportation equipment manufacturing industry cluster served as the foundation for this spatial analysis, conducted across six Midwestern states: Illinois, Indiana, Michigan, Minnesota, Ohio, and Wisconsin. Beginning with establishment data, the region encompasses a total of 2,276 unique establishments. Employing the spatial technique DBSCAN allows for identification of clusters among these establishments. However, before proceeding, it is necessary to calculate a search distance to be used as a parameter. This is achieved using the average nearest neighbor geoprocessing tool. The steps required for this operation are illustrated in Figure 1 below. Upon completion, the output summary reveals an observed mean distance of 5,472 meters, which will subsequently inform the DBSCAN analysis.
Figure 1: Average Nearest Neighbor
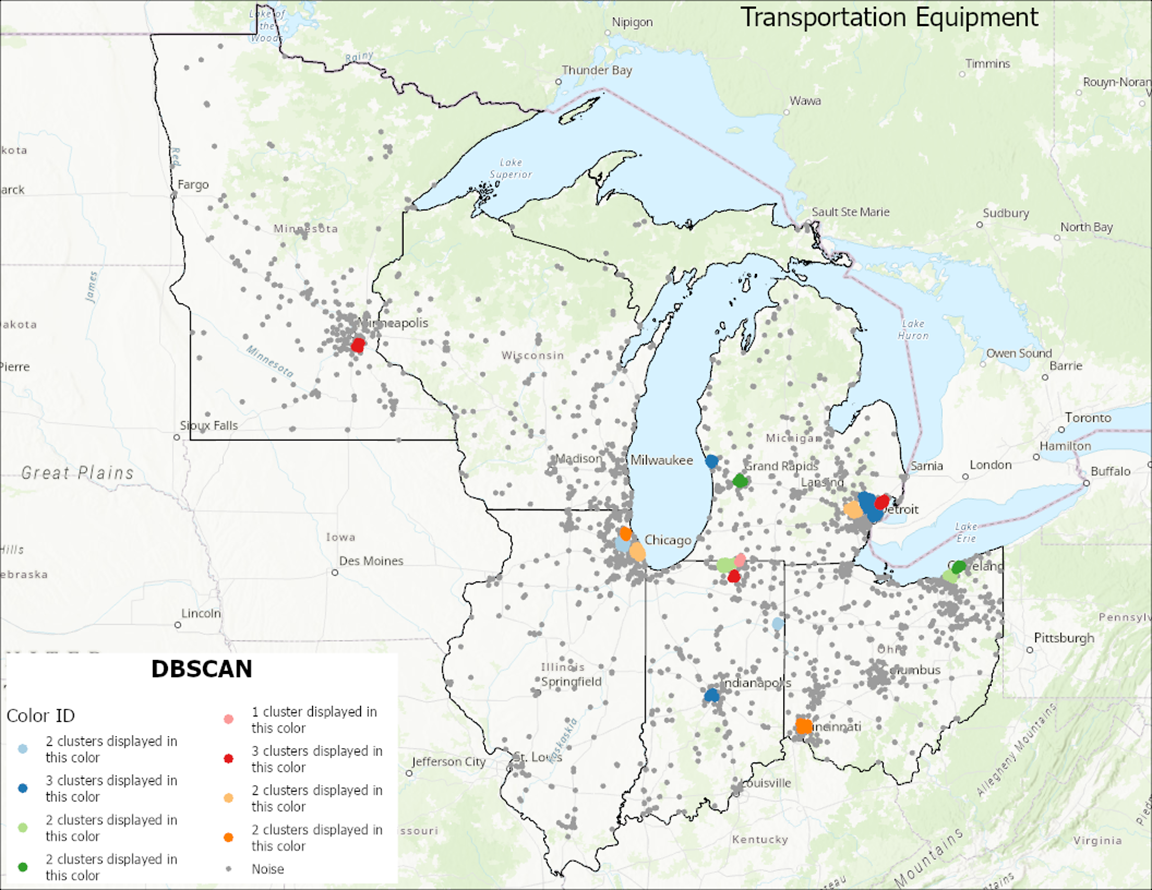
With the search distance now determined, and using a minimum of 10 features per cluster, the DBSCAN geoprocessing tool can be executed. The output reveals clusters within the region, depicted in Figure 2 below. Most states exhibit at least one cluster, with urban areas generally displaying more. Notably, the transportation equipment manufacturing cluster also manifests in rural and rural-mixed areas. Specifically, within Indiana, these clusters are located in Decatur and Elkhart counties, while in Michigan, they are found in Muskegon County.
Figure 2: DBSCAN
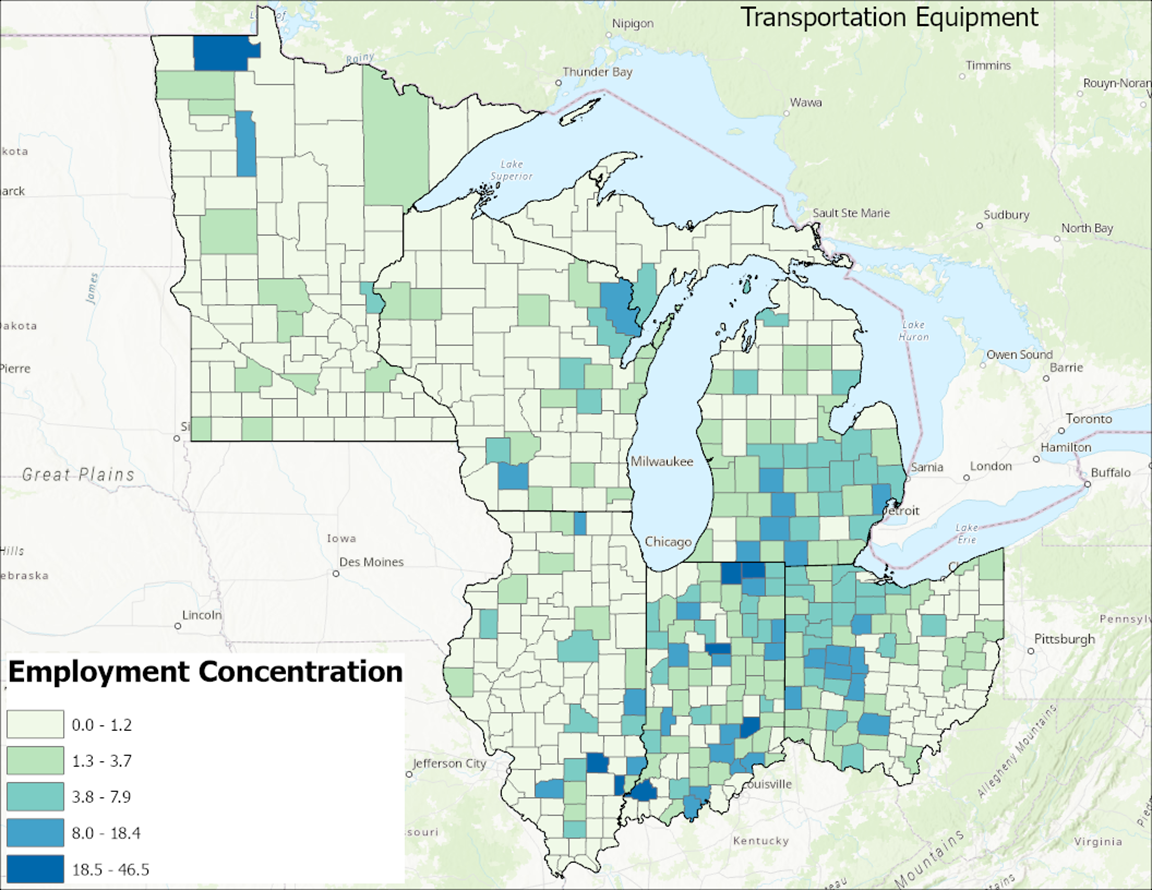
Adding employment concentration (EC) data for transportation equipment manufacturing, based on county-level data, can provide further insights. Recently, the term EC has been a replacement for the term Location Quotient (LQ). EC or LQ is a way of quantifying how concentrated a characteristic of a particular region is compared to the nation. These characteristics could be an industry’s share of employment, resident demographic, online profiles or job postings. The EC is the calculation that reveals what makes a particular region “unique” in comparison to the national average. The explanations and the EC data are provided by Lightcast. Figure 3 below illustrates the EC data mapped using natural breaks (Jenks). Note the specialization cut-off, where an EC value of 1.2 indicates a concentration of employment at least 20% higher than the national average. Darker shades of blue on the map represent counties with greater specialization in the transportation equipment industry cluster. Some counties exhibit the highest share of EC values. Notably, Gibson County, IN (46.5 EC), Elkhart County, IN (32.3 EC), and Edwards County, IL (29.6 EC) ranks the highest top three in the region. This is attributable to the presence of the Toyota manufacturing plant near Gibson County, IN and Edwards County, IL, as well as the significant RV manufacturing industry in Elkhart County, IN.
Figure 3: Employment Concentration
Once these two layers of establishments and employment concentration are finalized, they can be combined to visualize results spatially. Figure 4 depicts the outcomes, revealing the focal points of establishment clusters alongside areas of high employment concentration. Insights can be gathered from the map, such as St. Paul, MN, which exhibits a cluster but lacks counties with high EC. Southeast IL and southwest IN lack establishment clusters but feature counties with high EC. Lastly, northeast Indiana and the Detroit, MI area display both establishment clusters and counties with high EC.
Figure 4: Establishment & EC
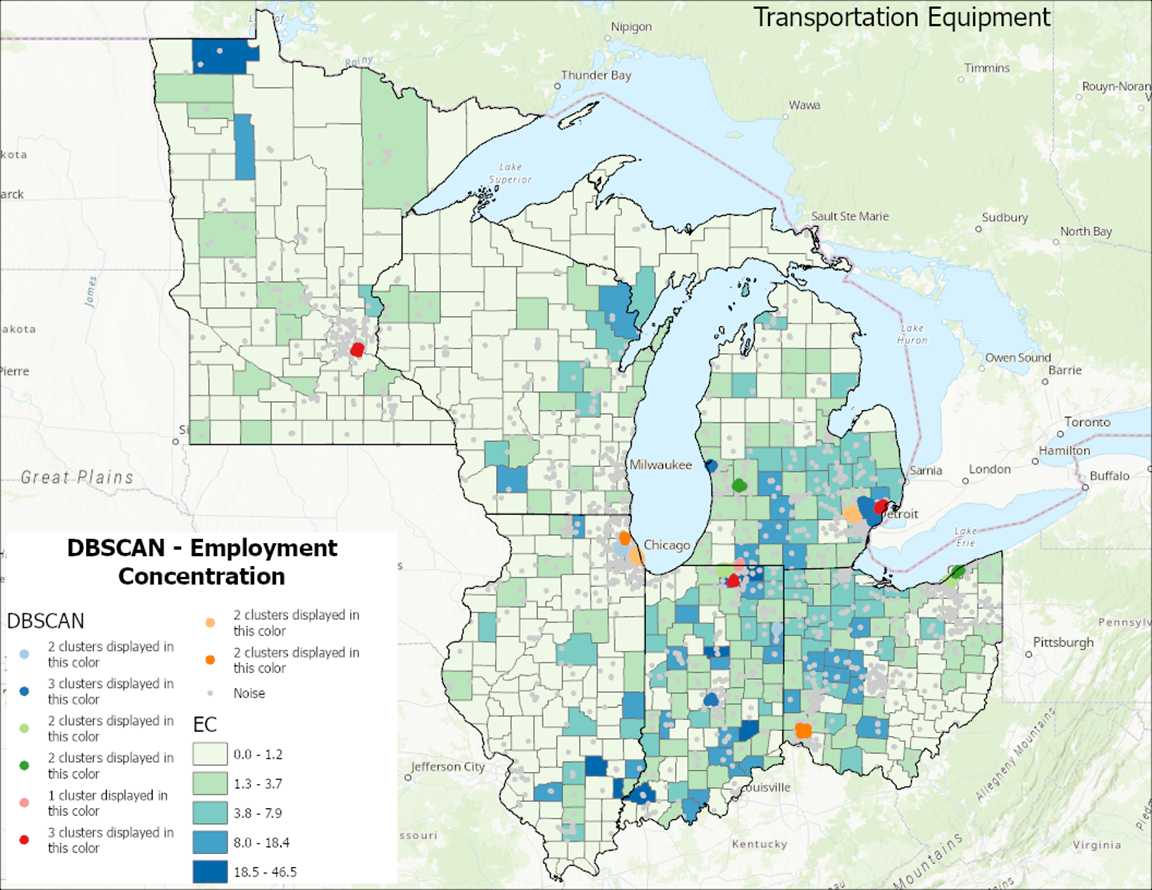
Spatial machine learning methods can be useful for spatial analysis of economic clusters. The methods provide spatial context to the industry clusters, and could be useful for planners and decision makers. It has the capacity to drill-down and identify geographic subclusters within an industry/economic cluster. For example, in Figure 4, we know that Detroit, MI has many establishments and higher employment concentration in transportation equipment cluster. The tool reveals subclusters within the Detroit metropolitan region. Industry cluster is a regional-level framework, and Esri spatial analysis tools provide the place-based context to the economic clusters.
The PCRD data team will be taking a deeper dive into spatial machine learning methods with their presentation “Economic Clusters: An Application of Spatial Machine Learning Methods” within ML/AI (Machine Learning/Artificial Intelligence) track on Thursday, May 16, 2024 at the Indiana Geographic Information Council (IGIC) conference in Michigan City, Indiana.
Disclaimer
This article is prepared by Purdue Center for Regional Development using Federal funds under award #ED23RNA0G0174 from the Economic Development Administration, U.S. Department of Commerce. The statements, findings, conclusions, and recommendations are those of the coauthors and do not necessarily reflect the views of Economic Development Administration or the U.S. Department of Commerce.

Benjamin St. Germain is a GIS Analyst for the Purdue Center for Regional Development, joining the staff in 2015. Benjamin uses a variety of data... read more


